Visible Memory Shrinking

I have a system with 8 GB of RAM on an AWS instance.

Code:
root@backslave-main-pr:/usr/home/m2msadmin # uname -a && dmesg | grep memory
FreeBSD backslave-main-pr 12.1-RELEASE-p2 FreeBSD 12.1-RELEASE-p2 GENERIC  amd64
real memory  = 9556721664 (9114 MB)
avail memory = 8170881024 (7792 MB)

running MariaDB. Over time, a growing portion of the total memory seems to disappear from FreeBSD's line of sight.
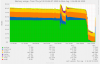
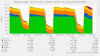
Starting here, top reports 8591 MB total
Code:
root@backslave-main-pr:/usr/home/m2msadmin # top | grep Mem
Mem: 642M Active, 379M Inact, 1230M Wired, 784M Buf, 5556M Free

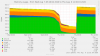
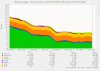
to this, after a few hours. top reports 2284 MB total
Code:
root@backslave-main-pr:/usr/home/m2msadmin # top  | grep Mem
Mem: 110M Active, 148K Inact, 388K Laundry, 1268M Wired, 783M Buf, 123M Free

Where could tbe missing 6GB be?
 
Your VM's resources have been reduced because it does not need that much. Once your VM uses more, it will get migrated to another host and it's resources adjusted. The automagic of professinal VM server plants works well behind the scenes...
 
In theory, that memory is available to me if I need it then?

Here's more context on how it happens. Based on what you just said, the little spike in the middle would be the app requesting more RAM and the VM making it available to the OS, until it goes unused again?

I was surprised to see RAM go down while my entire budget is active. Can I infer that memory that FreeBSD sees as inactive gets reclaimed?
 

Attachments

  • ram.png
    ram.png
    41.9 KB · Views: 125
Usually, the VM's OS is aware of the fact that it runs virtualized, and knows how to interact with the host through the use of specialized drivers (virtual memory, disk, etc.). It is common practice to overcommit on resources, like e.g. an aviation company commonly sells a few more tickets than there are seats in the plane. As long your applications run well, there's no need to worry. So the answer should be: yes.
 
So - I think I may a counterexample to the above, but I don't know how I can reproduce in a small contained example. It could also be specific to my setup somehow.

Here is a memory graph from 3 database server (mariadb 10.4 on FreeBSD 12.1-RELEASE-p2 GENERIC amd64)

See how the active memory on both slaves gradually shrinks in each case, up to the point of crashes.


Aug 5 00:37:45 backslave-main-pr kernel: pid 10496 (mysqld), jid 0, uid 88, was killed: out of swap space
Aug 6 05:45:52 backslave-main-pr kernel: pid 55545 (mysqld), jid 0, uid 88, was killed: out of swap space
Aug 6 05:45:56 backslave-main-pr kernel: pid 77367 (perl), jid 0, uid 65534, was killed: out of swap space
Aug 6 05:45:57 backslave-main-pr kernel: pid 686 (ntpd), jid 0, uid 123, was killed: out of swap space


Memory never goes inactive - always from active to missing, until the point where the OS can't perform an allocation.

Note that since these are all fruits of the same tree, I realize the DB & schema are suspect but since the OS is showing an ever shrinking memory space alotted to the DB, I am not sure where to go next. What can I do to further isolate the issue? Would a memory leak manifest itself as inactive memory or 'VM reclaimed' memory.

I'll think I can grow one of the slaves to quadruple memory and see how the behavior changes.
 

Attachments

  • slave2.png
    slave2.png
    46.7 KB · Views: 109
  • slave1.png
    slave1.png
    35.2 KB · Views: 110
  • master.png
    master.png
    40.9 KB · Views: 117
Insistently ask your VM provider's staff about this. If they start to complain: your system crashes, that should not happen. You've got a contract including an assertion on available resources (espc. RAM memory).
 
I will roll the -p8.

Now what to make of this:


last pid: 6910; load averages: 3.70, 3.88, 4.22 up 68+22:18:57 01:14:29
39 processes: 1 running, 38 sleeping
CPU: 29.0% user, 0.0% nice, 10.3% system, 3.1% interrupt, 57.6% idle
Mem: 1937M Active, 413M Inact, 291M Laundry, 2326M Wired, 1543M Buf, 330M Free
Swap:

PID USERNAME THR PRI NICE SIZE RES STATE C TIME WCPU COMMAND
48908 mysql 665 20 0 13G 12G select 0 33.4H 106.79% mysqld


Specifically do these lines

Mem: 1937M Active, 413M Inact, 291M Laundry, 2326M Wired, 1543M Buf, 330M Free
versus
48908 mysql 665 20 0 13G 12G select 0 33.4H 106.79% mysqld

indicate something off with the memory accounting in 'top' since mysql has 12G and the top line accounts for less than 6G?
 
Looks as if the accounting of shared memory is done as often as there are threads... Consider to file in a bug report. This AWS integration is fairly young, so there will more bugs than in more mature parts of the kernel.
 
Is the presumption at the moment that this is not a VM issue but a Freebsd-aws port issue? And the bug surfaces using top?

I just want to properly route the report and see if I can package it in a smaller environment.
 
Back
Top