Shrinked available RAM after upgrade to 13.1

Hi,

We have a strange problem with one of our web/jails servers. Everything was working fine through 12.x releases, but immediately after we upgraded from 12.3 to 13.1 server started "losing" RAM, couple GB per day.

Server is Supermicro SYS-6019P-MTR, with 128 GB RAM, ZFS ... Nothing extra in the /boot/loader.conf or /etc/sysctl.conf.

After two weeks, top, systat and vmstat show that system has 24 GB of RAM (when we calculate memory usage). But sysctl hw.physmem shows 128 GB.

Did anyone have experience with something similar?

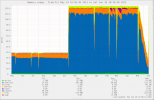
Here is munin graphs ... RAM upgrade was in the mid October, a then in May upgrade from 12.3 to 13.1.
 

Attachments

  • memory-pinpoint=1620982230,1655542230.png
    memory-pinpoint=1620982230,1655542230.png
    74.6 KB · Views: 81
  • memory-pinpoint=1652691030,1655542230.png
    memory-pinpoint=1652691030,1655542230.png
    91.9 KB · Views: 81
Not sure if I understand correctly. 24GB of RAM you are referring to is free RAM, right? Is it web server that is consuming most of the memory? What are the versions of used applications - have you checked their issue trackers for possible memory leak bugs? Is it possible that network traffic is higher and thus causing higher memory usage?
 
No, 24 GB is not free RAM. It's all RAM as you can see in the graphs. System first start to swap, then become sluggish and after reboot all the RAM is again here and available, as you can see on the second picture.
 
There is 128 GB of RAM as hw.physmem show, but top and systat in summary (active, wired, inacct, loundry, buf and free) shows 24 GB RAM. Or 54 GB for example couple days before.
 
There is 128 GB of RAM as hw.physmem show, but top and systat in summary (active, wired, inacct, loundry, buf and free) shows 24 GB RAM. Or 54 GB for example couple days before.
The rest is probably used up by ZFS's ARC. I'm going to suggest limiting the memory used for ARC. By default it will (try to) use everything (minus 1GB I believe).
 
Hi SirDice, thanks for suggestion. I forgot to mention, ARC have a limit at 40 GB. As you can see in the first graph everything working normal with 12.3, config files are the same. Only change was no more openzfs 2022Q1 port after we upgrade to 13.1.
 
One look at the graph is sufficient to see that it accounts for all possible memory page states.
And the sum of all bands should add up to total memory, just as the original poster said.

Unless there is a bug in how the stats are collected, the graph means that there is a leak of pages where they somehow leave one state but never enter another and become invisible o the system.
 
Andriy, thank you very much.

This is top 14 hours after reboot:
Code:
last pid: 77929;  load averages:  1.21,  1.13,  1.08                                                         up 0+14:54:40 21:10:07
158 processes: 1 running, 157 sleeping
CPU:  0.6% user,  0.0% nice,  0.1% system,  0.0% interrupt, 99.3% idle
Mem: 1643M Active, 17G Inact, 32G Wired, 72G Free
ARC: 28G Total, 13G MFU, 14G MRU, 13M Anon, 95M Header, 280M Other
     26G Compressed, 39G Uncompressed, 1.46:1 Ratio
Swap: 16G Total, 16G Free

And two days after reboot, with approx 3GB less:
Code:
last pid: 92372;  load averages:  0.77,  0.80,  0.75                                                        up 2+00:00:08  06:15:35
156 processes: 2 running, 154 sleeping
CPU:  5.6% user,  0.0% nice,  0.7% system,  0.0% interrupt, 93.7% idle
Mem: 3517M Active, 89G Inact, 482M Laundry, 23G Wired, 3714M Free
ARC: 18G Total, 6487M MFU, 11G MRU, 7536K Anon, 116M Header, 699M Other
     16G Compressed, 18G Uncompressed, 1.14:1 Ratio
Swap: 16G Total, 16G Free
 
An output of htop sorted by real-memory and virtual-memory usage could be interesting. Maybe some application is leaking over time.
 
Hi Andriy, do you think we should update bug report PR 256507 with these findings?
We have also noticed that the loss is not linear, but is happening in steps. Most of the days, it would be seen on Munin graph at 04:00, but when the visible RAM falls enough to start swapping, the interval shortens, so it could happen on any 1 or 2 hours mark.
We have checked cron jobs, there is nothing that should obviously cause this.
 
Adding information to a PR is never a bad idea, IMO.
But I don't know if anyone (qualified) is looking into that issue.
Perhaps, the additional info will spark some interest.
 
No solution but at least you can run this script every few minutes to see the difference between page count and the sum of all other counts!
Code:
mem-use() {
  echo -n "$(date '+%F %T') ";
  sysctl vm.stats | fgrep count|\
  awk '{sum+=count; count=$2;} END {print "page-count:",count,"diff:",count-sum;}'
}
On my UFS machine the difference is positive, on my ZFS machine it is negative and increasing over time. Ideally the difference should be 0 (or close to it). That is, all the memory should be accounted for.

You can use this script if you want to experiment. e.g "mem-use; expriment; mem-use" to test your page leak theories!
 
Alright, so if:

vm.stats.vm.v_page_count - (vm.stats.vm.v_free_count + vm.stats.vm.v_wire_count + vm.stats.vm.v_active_count + vm.stats.vm.v_inactive_count + vm.stats.vm.v_laundry_count)

sysctl vm.stats.vm | grep count
Code:
vm.stats.vm.v_cache_count: 0
vm.stats.vm.v_user_wire_count: 0
vm.stats.vm.v_laundry_count: 197905
vm.stats.vm.v_inactive_count: 1599905
vm.stats.vm.v_active_count: 67742
vm.stats.vm.v_wire_count: 2470826
vm.stats.vm.v_free_count: 106218
vm.stats.vm.v_page_count: 4054374

4054374 - (106218 + 2470826 + 67742 + 1599905 + 197905) = -388222

uname -a
FreeBSD zfsstore.local 12.3-RELEASE-p5 FreeBSD 12.3-RELEASE-p5 GENERIC amd64

uptime
11:22AM up 11 days, 12:24, 1 user, load averages: 0.01, 0.07, 0.07

kldstat
Code:
Id Refs Address                Size Name
 1   26 0xffffffff80200000  2295a98 kernel
 2    1 0xffffffff82496000    687a0 arcsas.ko
 3    1 0xffffffff82efa000   24ca08 zfs.ko
 4    1 0xffffffff83147000     75a8 opensolaris.ko
 5    1 0xffffffff8314f000     1a20 fdescfs.ko
 6    1 0xffffffff83151000     2150 acpi_wmi.ko
 7    1 0xffffffff83154000     2698 intpm.ko
 8    1 0xffffffff83157000      b40 smbus.ko
 9    1 0xffffffff83158000      acf mac_ntpd.ko

top
Code:
last pid: 50075;  load averages:  0.06,  0.07,  0.07   up 11+12:25:13  11:24:20
38 processes:  1 running, 37 sleeping
CPU:  0.0% user,  0.0% nice,  0.1% system,  0.0% interrupt, 99.8% idle
Mem: 265M Active, 6250M Inact, 773M Laundry, 9652M Wired, 1550M Buf, 414M Free
ARC: 5811M Total, 1754M MFU, 3606M MRU, 160K Anon, 45M Header, 406M Other
     4601M Compressed, 4999M Uncompressed, 1.09:1 Ratio
Swap: 3852M Total, 3852M Free

sysctl hw | egrep 'hw.(phys|user|real)'
Code:
hw.physmem: 17061474304
hw.usermem: 7019118592
hw.realmem: 17179869184

Then I guess this is leaking too?
 
Thanks everyone for suggesions, i don't think is a memory leak (to be precise i don't know), to put it in the "normal" language, more like every other day your system have less total RAM. You start with 128 GB, a then after 15 days you have 24 GB and server start to swap and to be sluggish. Like there is no more 104 GB of RAM. And the same system, with same setup and config work normal for several years with 12.x branch and the problem start very first (second) day after we upgrade to 13.1. Only good thing is that te whole problem is repeatable. We reboot, everything is normal till the 1am then we loss apprx 3 GB of RAM. And then next 24h everything is normal no matter of the load. We disable all /etc/crontab jobs on host and in jails but no luck. Very strange.
 
till the 1am then we loss approx 3 GB of RAM. And then next 24h everything is normal no matter of the load. We disable all /etc/crontab jobs on host and in jails but no luck. Very strange.
Is some remote backup started at that time? i.e. something that isn't controlled on the hypervisor/guests/jails.
 
There is a remote backup to our central zfs backup storage, but every 4 hours, just plain basic zfs send/receive of snapshots. Bakul, here is results from your script:

2022-06-23 21:45:00 page-count: 32586155 diff: 1923617 2022-06-23 21:50:00 page-count: 32586155 diff: 1917848 2022-06-23 21:55:00 page-count: 32586155 diff: 1910378 .... 2022-06-23 23:30:00 page-count: 32586155 diff: 1921720 2022-06-23 23:35:00 page-count: 32586155 diff: 1923309 ... 2022-06-24 00:15:00 page-count: 32586155 diff: 1929766 2022-06-24 00:20:00 page-count: 32586155 diff: 1926295 2022-06-24 00:15:00 page-count: 32586155 diff: 1929766 2022-06-24 00:20:00 page-count: 32586155 diff: 1926295 2022-06-24 00:25:00 page-count: 32586155 diff: 1932280 2022-06-24 00:30:00 page-count: 32586155 diff: 1931207 2022-06-24 00:35:00 page-count: 32586155 diff: 1939031 2022-06-24 00:40:00 page-count: 32586155 diff: 1929697 2022-06-24 00:45:00 page-count: 32586155 diff: 1933848 2022-06-24 00:50:00 page-count: 32586155 diff: 1930306 2022-06-24 00:55:00 page-count: 32586155 diff: 1925179 2022-06-24 01:00:00 page-count: 32586155 diff: 1931087 2022-06-24 01:05:00 page-count: 32586155 diff: 1932507 2022-06-24 01:10:00 page-count: 32586155 diff: 1934875 2022-06-24 01:15:00 page-count: 32586155 diff: 1935032 2022-06-24 01:20:00 page-count: 32586155 diff: 1935485 2022-06-24 01:25:00 page-count: 32586155 diff: 1938934 2022-06-24 01:30:00 page-count: 32586155 diff: 1930164 2022-06-24 01:35:00 page-count: 32586155 diff: 1922980 2022-06-24 01:40:00 page-count: 32586155 diff: 1941341 2022-06-24 01:45:00 page-count: 32586155 diff: 1935204 2022-06-24 01:50:00 page-count: 32586155 diff: 1941575 2022-06-24 01:55:00 page-count: 32586155 diff: 1933503 2022-06-24 02:00:00 page-count: 32586155 diff: 1935324 2022-06-24 02:05:00 page-count: 32586155 diff: 1939179 2022-06-24 02:10:00 page-count: 32586155 diff: 1941225 2022-06-24 02:15:00 page-count: 32586155 diff: 1932783 2022-06-24 02:20:00 page-count: 32586155 diff: 1943121 2022-06-24 02:25:00 page-count: 32586155 diff: 1954573 2022-06-24 02:30:00 page-count: 32586155 diff: 1939494 2022-06-24 02:35:00 page-count: 32586155 diff: 1935688 2022-06-24 02:40:00 page-count: 32586155 diff: 1928619 2022-06-24 02:45:00 page-count: 32586155 diff: 1948324 2022-06-24 02:50:00 page-count: 32586155 diff: 1944477 2022-06-24 02:55:00 page-count: 32586155 diff: 1936978 2022-06-24 03:00:00 page-count: 32586155 diff: 1944301 2022-06-24 03:05:00 page-count: 32586155 diff: 1953183 2022-06-24 03:10:00 page-count: 32586155 diff: 1947894 2022-06-24 03:15:00 page-count: 32586155 diff: 1994986 2022-06-24 03:20:00 page-count: 32586155 diff: 2031970 2022-06-24 03:25:00 page-count: 32586155 diff: 2051262 2022-06-24 03:30:00 page-count: 32586155 diff: 2034459 2022-06-24 03:35:00 page-count: 32586155 diff: 2036218 2022-06-24 03:40:00 page-count: 32586155 diff: 2115054 2022-06-24 03:45:00 page-count: 32586155 diff: 2114452 2022-06-24 03:50:00 page-count: 32586155 diff: 2130002 2022-06-24 03:55:00 page-count: 32586155 diff: 2172569 2022-06-24 04:00:00 page-count: 32586155 diff: 2185751 2022-06-24 04:05:00 page-count: 32586155 diff: 2203994 2022-06-24 04:10:00 page-count: 32586155 diff: 2250407 2022-06-24 04:15:00 page-count: 32586155 diff: 2269073 2022-06-24 04:20:00 page-count: 32586155 diff: 2286378 2022-06-24 04:25:00 page-count: 32586155 diff: 2308035 2022-06-24 04:30:00 page-count: 32586155 diff: 2296172 ... 2022-06-24 06:30:00 page-count: 32586155 diff: 2311453 2022-06-24 06:35:00 page-count: 32586155 diff: 2302638 2022-06-24 06:40:00 page-count: 32586155 diff: 2297604
 
Thanks everyone, that's ours main web server so this morning we activate old bectl environment and revert back to 12.3. 13.1 snapshot is still here so maybe we try it once again in the future.

last mem_use.sh with 13.1
2022-06-28 05:05:00 page-count: 32586155 diff: 3877043

and next one with 12.3
2022-06-28 06:00:00 page-count: 32606995 diff: 18872
 
Hi, I encountered the same issue. Based on the sysctl outputs below, I think the lost memory is due to unswappable pages because the unswappable page count is increasing and RAM is decreasing in the outputs of the top command. However, I don't know why.


vm.stats.vm.v_laundry_count: 56910
vm.stats.vm.v_inactive_count: 329390
vm.stats.vm.v_active_count: 313255
vm.stats.vm.v_wire_count: 132393
vm.stats.vm.v_free_count: 44036
vm.stats.vm.v_page_count: 1000174
vm.stats.vm.v_page_size: 4096

vm.domain.0.stats.unswappable: 98333
vm.domain.0.stats.laundry: 56910
vm.domain.0.stats.inactive: 329390
vm.domain.0.stats.active: 313255
vm.domain.0.stats.free_count: 44036
 
Back
Top