Solved Server keep running out of RAM

Hi Guys,

At the beginning of December, I installed /net-mgmt/netdata as we started to see a performance issue with our websites hosted on FreeBSD jails.
Following the installation, we kept seeing errors in relation to swapping. We looked closer and saw that the server was running out of RAM.
The server had 24GB RAM so we went to the Datacenter and added an extra 24GB making the current total to 48GB RAM .
In the last few days, we are receiving emails from Zabbix saying that cannot connect the server... We looked at the Zabbix graphs to investigate and realised that we are now out f RAM again!!
vmstat -w 1 -c 25
Code:
procs  memory       page                    disks     faults         cpu
r b w  avm   fre   flt  re  pi  po    fr   sr mf0 mf1   in    sy    cs us sy id
0 0 0  40G  1.2G  1884   1   5   0  1717  917   0   0  454   774  3031  9  6 85
1 0 0  40G  1.2G  4163   0   0   0  3196 1148   1   1  140  6860  1988  1  2 96
1 0 0  40G  1.2G 13392   0   0   0 13933 1139   5   5  333 13984  3143  2  3 95
1 0 0  40G  1.2G  6610   0   0   0  5980 1147  88  88  699 70626  9809  7 10 83
0 0 0  40G  1.2G 12852   0   1   0 11689 1137   5   4  302 43171  2932  4  5 91
0 0 0  40G  1.2G 13067   0   0   0 11883 1169   4   3  319 11258  2466  1  3 96
0 0 0  40G  1.2G 14502   0   0   0 13348 1154   3   2  312 13472  2437  1  3 96
0 0 0  40G  1.2G  1399   0   0   0  2244 1151   0   0   45  2043  1135  0  2 98
0 0 0  40G  1.2G 19054   0   0   0 17296 1173 116 117 1093 17481 11163  1  4 95
0 0 0  40G  1.2G 12314   0   2   2 11685 1187   0   2  184 12043  2031  0  4 96
1 0 0  40G  1.3G  9889   0   0   0 36767 1101   7   7  252 61628  3153  4  7 89
0 0 0  39G  1.4G  2405   0  14   0 30271 1044   7   4  124 21832  3360  5  4 91
1 0 0  39G  1.5G  1967   0   0   0 30596 1044   5   6  101  1897  1423  0  2 98
2 0 0  39G  1.5G 16479   0   0   0  4548 1018 129 135  921 48197 12523  7  7 85
3 0 0  39G  1.4G 22208   0   5   0  5766 1020  18  18  166 34850  5558 15  7 78
1 0 0  39G  1.4G 11475   0  28   0 23248 1042   7   9  118 13424  5661 13  4 82
0 0 0  39G  1.4G   279   0   0   0   620 1043  12  12  135  1191  1706  0  2 98
0 0 0  39G  1.4G  1394   0   0   0   915 1046   0   0   71  1955  1293  0  2 98
0 0 0  39G  1.5G  1121   0   0   0  9732 1024 102 108  678  1079 10897  0  2 98
1 0 0  39G  1.5G   929   0   0   0  9567 2013   6   6   84 46150  1969  3  6 91
1 0 0  39G  1.5G   606   0   7   0  1067 1010  11   9   88 58482  4054  6  6 87
1 0 0  39G  1.5G   610   0   7   2  1137 1000  10   8   87 59121  4082  6  7 86
2 0 0  39G  1.5G  1495   0   7   0  1461 1005  75  75  529 86088 10326 11  9 80
3 0 0  39G  1.5G   586   0   8   0   549 1036   9   4   73 123575  4298 14 13 73
2 0 0  39G  1.5G   367   0   2   0  1062  997   8   5   95 106354  3960 13 10 77
When I look at htop, and see that I have 132M/12G in swap

Could anyone please help understand how to troubleshoot this issue so I can understand why I keep running out of RAM and get performance issue?
I run 1x bhyve VM and 20 Jail (1x database, 1x mail, 1web reverse proxy and 17 webservers)
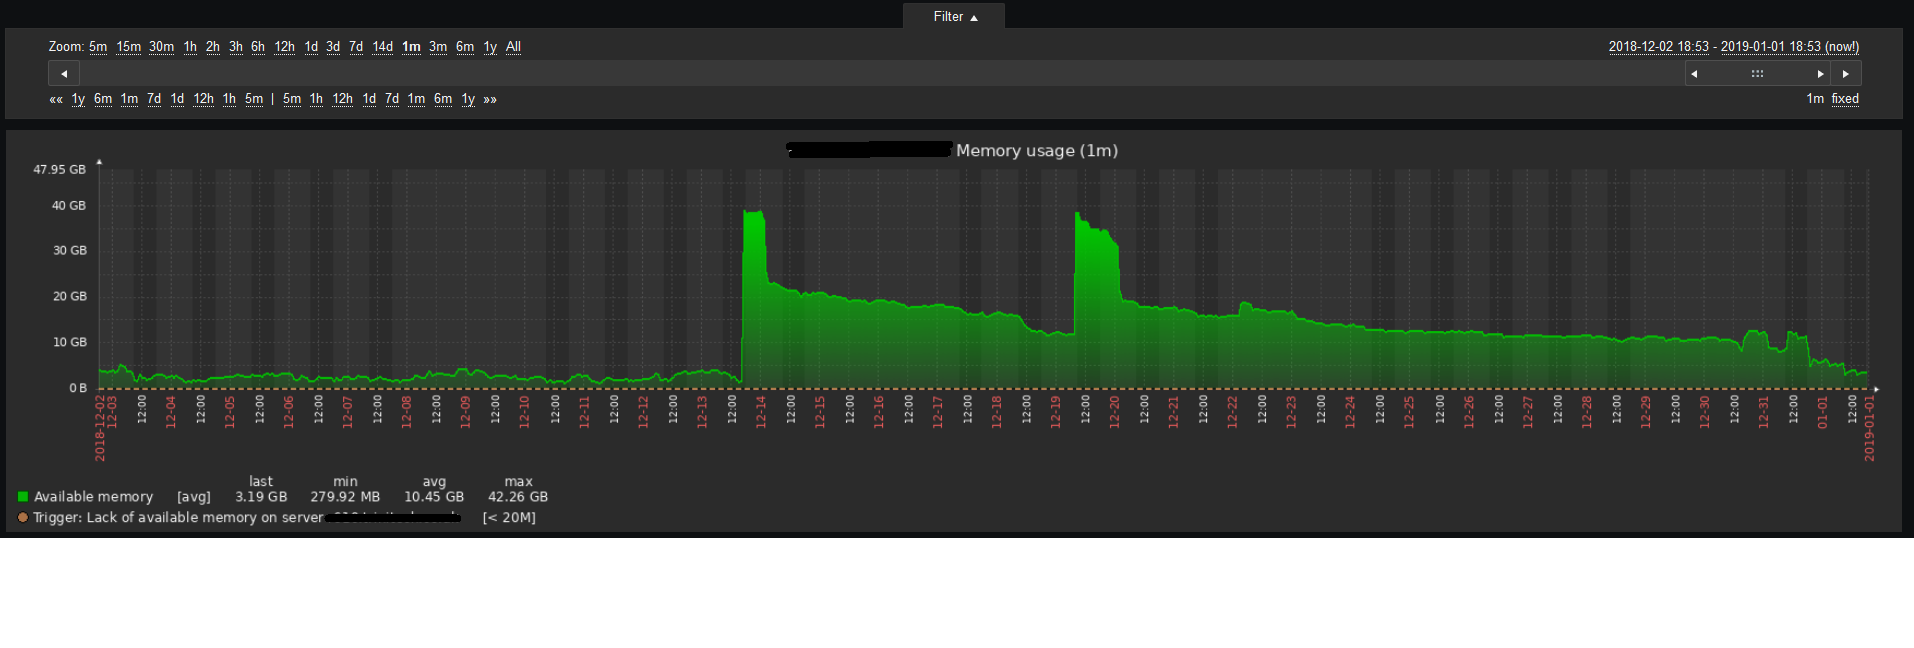
zabbix-memory-issue.png


Thank you in advance
 
Bobi B. thank you for your reply.
Bellow are the results you asked for.
uname -a
Code:
FreeBSD r610.mydomain.co.uk 11.2-RELEASE-p5 FreeBSD 11.2-RELEASE-p5 #0: Tue Nov 27 09:33:52 UTC 2018     root@amd64-builder.daemonology.net:/usr/obj/usr/src/sys/GENERIC  amd64
ps auxwwS -m
Output file
top -S -osize -d1
Code:
last pid: 94912;  load averages:  2.45,  1.95,  1.93                                                                                                                                                                                                  up 13+10:49:11  19:52:18
275 processes: 4 running, 268 sleeping, 2 zombie, 1 waiting
CPU:     % user,     % nice,     % system,     % interrupt,     % idle
Mem: 2648M Active, 2067M Inact, 2298M Laundry, 38G Wired, 1706M Free
ARC: 32G Total, 7115M MFU, 23G MRU, 43M Anon, 464M Header, 1240M Other
     28G Compressed, 45G Uncompressed, 1.61:1 Ratio
Swap: 12G Total, 132M Used, 12G Free, 1% Inuse

  PID USERNAME    THR PRI NICE   SIZE    RES STATE   C   TIME    WCPU COMMAND
83504    975      876  52    0  3062M   818M uwait   0  50:23   0.00% java
28474 root         21  20    0  2108M 38548K kqread  2   2:30   0.00% bhyve
30420    975       33  52    0  1205M   410M uwait   3  60:57   0.00% mongod
 5528     88       33  52    0   900M   582M select  2  62.1H   0.20% mysqld
30563     88       31  20    0   793M   478M select  1   6:40   0.00% mysqld
66284    106        2  20    0   640M   580M select  2  23:04   0.00% clamd
53641 netdata      14  52   19   584M   547M pause   1 705:28   5.08% netdata
87928 oleg          1  38    0   315M   186M accept  0   0:09  10.99% php-fpm
 9945 oleg          1  52    0   315M   185M accept  6   0:08   5.47% php-fpm
43118 fred          1  45    0   282M   130M accept  6   0:27   0.00% php-fpm
24666 fred          1  42    0   279M   126M accept  2   0:22  27.78% php-fpm
82565   1004       14  52   19   263M   225M pause   5 654:54   4.39% netdata
82537   1004        1  28    0   257M   102M CPU5    5   4:00   6.98% php-fpm
83352   1004        1  52    0   253M    99M accept  3   1:40  10.16% php-fpm
98547 root          1  20    0   235M 18028K kqread  4   0:38   0.00% php-fpm
12784 www           1  52    0   235M 17944K accept  4   0:00   0.00% php-fpm
 5962 www           1  52    0   235M 17944K accept  6   0:00   0.00% php-fpm
90506 fred          1  28    0   230M   140M accept  1   0:11   0.00% php-fpm
16560 fred          1  27    0   230M   140M accept  3   0:11   0.00% php-fpm
35884 fred          1  52    0   212M   119M accept  7   1:52  32.57% php-fpm
49983 fred          1  52    0   208M   117M accept  4   0:40  38.77% php-fpm
20651 fred          1  48    0   206M   120M accept  4   0:43  18.55% php-fpm
46897 fred          1  52    0   205M   105M accept  2   0:01   0.00% php-fpm
81037 www           1  20    0   204M 47984K lockf   2   0:01   0.00% httpd
11520 www           1  20    0   204M 48700K lockf   7   0:01   0.00% httpd
57946 www           1  20    0   204M 51448K lockf   2   0:01   0.00% httpd
32275 www          48  20    0   198M 77568K select  4   7:59   0.00% hiawatha
  963 fred          1  52    0   185M 96316K accept  0   0:00   1.46% php-fpm
97908 www           1  20    0   179M 48280K lockf   1   0:01   0.00% httpd
 3249 www           1  20    0   178M 41324K lockf   2   0:01   0.00% httpd
75434 www           1  20    0   178M 41356K lockf   2   0:01   0.00% httpd
50884 www           1  20    0   178M 46928K lockf   2   0:01   0.00% httpd
43998 www           1  20    0   178M 46560K lockf   3   0:00   0.00% httpd
48401 www           1  20    0   178M 44836K lockf   0   0:01   0.00% httpd
33644 www           1  20    0   178M 39984K kqread  0   0:00   0.00% httpd
85145 www           1  35   15   176M 90936K kqread  1  24:59   0.00% nginx
44906 root          1  20    0   175M 34584K select  1   0:29   0.00% httpd
14305 root          1  20    0   171M 18632K kqread  3   0:34   0.00% php-fpm
21438 www           1  47    0   171M 18612K accept  3   0:00   0.00% php-fpm
27620 www           1  48    0   171M 18612K accept  5   0:00   0.00% php-fpm
19423 root          1  20    0   171M 16556K kqread  1   0:38   0.00% php-fpm
68832 www           1  52    0   171M 15596K accept  2   0:00   0.00% php-fpm
61296 www           1  52    0   171M 15592K accept  5   0:00   0.00% php-fpm
52910 root          1  20    0   171M 15560K kqread  3   0:20   0.00% php-fpm
44865 root          1  20    0   171M 17972K kqread  1   0:38   0.00% php-fpm
28200 www           1  52    0   171M 16436K accept  6   0:00   0.00% php-fpm
22979 www           1  52    0   171M 16436K accept  2   0:00   0.00% php-fpm
47603 www           1  52    0   171M 17960K accept  7   0:00   0.00% php-fpm
47360 www           1  52    0   171M 17960K accept  3   0:00   0.00% php-fpm
68725 root          1  20    0   171M 20116K kqread  0   0:31   0.00% php-fpm
79408 www           1  52    0   171M 20100K accept  2   0:00   0.00% php-fpm
74085 www           1  52    0   171M 20100K accept  4   0:00   0.00% php-fpm
28451 root          1  20    0   171M 20272K kqread  5   0:50   0.00% php-fpm
72211 root          1  20    0   171M 17820K kqread  3   0:45   0.00% php-fpm
63233 root          1  20    0   171M 17440K kqread  3   0:35   0.00% php-fpm
34633 www           1  52    0   171M 20252K accept  4   0:00   0.00% php-fpm
32291 www           1  52    0   171M 20252K accept  3   0:00   0.00% php-fpm
86335 www           1  52    0   171M 17736K accept  2   0:00   0.00% php-fpm
80697 www           1  52    0   171M 17736K accept  4   0:00   0.00% php-fpm
70044 www           1  52    0   171M 17436K accept  2   0:00   0.00% php-fpm
65224 www           1  52    0   171M 17436K accept  5   0:00   0.00% php-fpm
64100 root          1  20    0   170M 15284K kqread  4   0:21   0.00% php-fpm
 
IMHO ZFS's ARC ate too much RAM and starved other processes. Try to set a limit using vfs.zfs.arc_max (Maximum ARC size) toggle: sysctl vfs.zfs.arc_max=27917287424 (that is about 26GB taken from one of office servers with 32GB of physical RAM).

Calculate how much RAM your server processes need and subtract it from installed RAM size.

If you decide to apply it permanently add it to /etc/sysctl.conf and apply it with sysctl -f /etc/sysctl.conf.

Edit: There is nothing bad in swap being in use -- you have enough free RAM -- unless it is reading from swap frequently. Unixes tend to write to swap VM pages not being accessed for awhile, as it is always better to have more free physical RAM to work with.
 
Bobi B. thank you for the feedback :)
It is quite reassuring to know its not a big issue and can be fixed fairly easily.
Is my current ARC set to 32GB? I am guessing it is the number I see in the top command. is there another way to check?
 
Take a look at first point in ZFS Advanced Topics in FreeBSD Handbook. By default ZFS maxes ARC size to RAM size - 1GB and that is pretty greedy. Even that ZFS is clever, will monitor RAM use and will auto-tune ARC size, i.e. lower ARC size on hosts running memory-hungry services, under load you might experience excessive swapping, even kernel panics, if swap not large enough; but even if swap is large enough, once paging starts the system will almost halt.

If I were you, I would try to see how much RAM my services need. You run bhyve, therefore add up memory size, allocated to the VMs. I don't have much experience with MySQL, but databases can be given some RAM usage limits; add up those numbers, as well. You run lots of Application servers, regardless jailed or not, add up their RAM usage.

There is no one rule to fit all cases, also memory services use is not constant. A command like this might help: ps axS -o vsz,comm | awk '{sum += $1} END {print sum}': you should get current total virtual size in use, in KB. Add-up some extra overhead, subtract this from RAM size, give the rest to ZFS. Monitor memory usage as there is no point to keep too much free RAM.

PS: Best search for more information around the Web.
 
Just a little hint: From your output of vmstat(8) it is clear that the system is not out of RAM. There is near zero paging activity (the “po” column), and the scan rate (“sr”) is not unusual for a system like yours. These two columns are a very good indication whether a system is running low on RAM or not. Apart from that, there is almost no swap in use (132 MB of 12 GB is nothing).

Unfortunately, many third-party tools that monitor RAM usage provide misleading numbers. In particular, monitoring “free RAM” is often not helpful, because it is normal that the amount of free RAM reaches a rather low number, sooner or later. That's because free RAM is considered wasted, so the system tries to use it for caching and other purposes to improve performance.

As others have mentioned, you might want to lower the limit of the ARC's size. Actually it adapts to the memory pressure of the VM system pretty well, and I think it also does so in your case. But you can try if adjusting it improves your situation.

Bottom line: If you have any problems (connectivity, whatever), They're probably not caused by RAM shortage.
 
top(1)


ZFS ARC Stats
These stats are only displayed when the ARC is in use.

Total number of wired bytes used for the ZFS ARC
MRU number of ARC bytes holding most recently used data
MFU number of ARC bytes holding most frequently used data
Anon number of ARC bytes holding in flight data
Header number of ARC bytes holding headers
Other miscellaneous ARC bytes
Compressed bytes of memory used by ARC caches
Uncompressed bytes of data stored in ARC caches before compression
Ratio compression ratio of data cached in the ARC
 
Last edited:
Back
Top