c++ spinning randomly during port builds

I am having a really bizzare and apparently non-deterministic problem when trying to compile some ports on my RPI3B+ with FreeBSD 14.1. An instance of the compiler will just get "stuck" and "spin". I know those aren't very technical terms, but I dont know what else to call it. It has happened comiling both mysql80-server and mysql84-server. The RPI3B+ has four CPUs and the ports system correctly fires off up to four different processes at once, but sometimes, after crunching away for anywhere between several minutes and a few hours, one or more of the processes will just sit and use CPU time without driving ANY io or page faults but it steadly accumulates CPU time as verified with vmstat. I have been monitoring memory, swap, and other system resources, and everything seems fine. I have so far observed that from 1 to 3 processes suffer this fate during one build attempt. Smaller builds (e.g "htop") have not had the problem suggesting it may be probablistic. At first, I assumed something was catastrophically wrong, so I would do a "make clean" and start over, but recently discovered that if I killed things with INT (control c) and started them again, it would run to completion and be installable!

Anyway - this is HIGHLY annoying, and I'd really like to be able to build whatever ports I want when I need to, and so I would really welcome any suggestions you may have on how to narrow this down. Since it is so highy variant in its behavior, I'm rather at a loss on how to proceed with debugging this. This will probably end up with me submitting a bugzilla PR, but right now, I don't feel like I have enough specific information to make that possible or valuable.

I'll lay out my most recent experience, of which I also gathered the most data.

I was building mysql80-server 8.0.39 using the HEAD/latest of ports. I do have some information from earlier attempts, but I wasn't as thorough with them.
# uname -a
FreeBSD generic 14.1-RELEASE-p3 FreeBSD 14.1-RELEASE-p3 GENERIC arm64

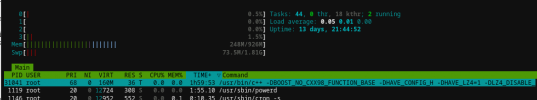
After a while, it became evident that one of the compiles was "stuck" (for lack of a better term). A compile had accumulated nearly two HOURS of CPU time. (In other build attempts, I have had one process with 11 hours and two others with over 4 hours.) At that point, I suspended the process to leave as many resources as possible to the other processes (the process status is "T"). See the "cxx_stuck" image attached. Note that it doesn't seem to matter if I've done the suspend thing or not. Eventually, "make" stopped firing off new processes. I assume it did all the work it could do without the "stuck" compile completing. I allowed the "stuck" process to continue but nothing advanced. At this point, I used "ps -p 31041 -www -o command" to capture the complete invocation of the process.

Code:
/usr/bin/c++ -DBOOST_NO_CXX98_FUNCTION_BASE -DHAVE_CONFIG_H -DHAVE_LZ4=1 -DLZ4_DISABLE_DEPRECATE_WARNINGS -DMUTEX_EVENT -D_USE_MATH_DEFINES -D__STDC_FORMAT_MACROS -D__STDC_LIMIT_MACROS -I/usr/ports/databases/mysql80-server/work/.build -I/usr/ports/databases/mysql80-server/work/.build/include -I/usr/ports/databases/mysql80-server/work/mysql-8.0.39 -I/usr/ports/databases/mysql80-server/work/mysql-8.0.39/include -I/usr/ports/databases/mysql80-server/work/mysql-8.0.39/storage/innobase -I/usr/ports/databases/mysql80-server/work/mysql-8.0.39/storage/innobase/include -I/usr/ports/databases/mysql80-server/work/mysql-8.0.39/sql -isystem /usr/ports/databases/mysql80-server/work/mysql-8.0.39/extra/protobuf/protobuf-24.4/src -isystem /usr/local/include/editline -isystem /usr/ports/databases/mysql80-server/work/mysql-8.0.39/extra/zlib/zlib-1.2.13 -isystem /usr/ports/databases/mysql80-server/work/.build/extra/zlib/zlib-1.2.13 -isystem /usr/ports/databases/mysql80-server/work/mysql-8.0.39/extra/zstd/zstd-1.5.5/lib -std=c++17 -fno-omit-frame-pointer -ftls-model=initial-exec -O2 -pipe -fPIC -fstack-protector-strong -isystem /usr/local/include -fno-strict-aliasing -march=armv8-a+crc+crypto -isystem /usr/local/include -std=c++17 -moutline-atomics -Wall -Wextra -Wformat-security -Wvla -Wundef -Wmissing-format-attribute -Woverloaded-virtual -Wcast-qual -Wno-null-conversion -Wno-unused-private-field -Wconditional-uninitialized -Wdeprecated -Wextra-semi -Wheader-hygiene -Wnon-virtual-dtor -Wundefined-reinterpret-cast -Wrange-loop-analysis -Winconsistent-missing-destructor-override -Winconsistent-missing-override -Wshadow-field -ffunction-sections -fdata-sections -O2 -pipe -fPIC -fstack-protector-strong -isystem /usr/local/include -fno-strict-aliasing -march=armv8-a+crc+crypto -isystem /usr/local/include -std=c++17 -DNDEBUG -fPIE -Wshadow-uncaptured-local -MD -MT utilities/CMakeFiles/perror.dir/perror.cc.o -MF CMakeFiles/perror.dir/perror.cc.o.d -o CMakeFiles/perror.dir/perror.cc.o -c /usr/ports/databases/mysql80-server/work/mysql-8.0.39/utilities/perror.cc
I put this in a file at ~freebsd/cmd.

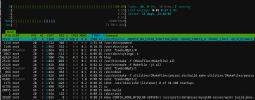
Then I captured another htop screen which shows many of the processes waiting on the "stuck" one to complet - see htop_css_stuck. After that I killed the process.

Now, this might be instructive - I checked for the presense of the output (object) file for that compile and there was nothing there, though other object files were present. Maybe that gives us some insight into where the compiler is getting stuck, if it hasn't even created the output file yet. Then I ran "make build" again and it ran quickly to completion. Just for rigor, I checked for the object file, and now it was present:
Code:
# ls -l work/.build/utilities/CMakeFiles/perror.dir/perror.cc.o
-rw-r--r--  1 root wheel 1384384 Aug 23 13:35 work/.build/utilities/CMakeFiles/perror.dir/perror.cc.o

After that, "make install" worked perfectly, too.
I started the database and did some checks - it appears everything is working.

So - I wanted to see just how long it actually took to compile this one file:
Code:
# time `cat ~freebsd/cmd`
        8.41 real         6.30 user         0.35 sys
That's right - the compile that had accumulated over 2 hours of CPU time took 6.65 seconds to compile. I verified that I really had recompiled the file
Code:
# ls -l work/.build/utilities/CMakeFiles/perror.dir/perror.cc.o
-rw-r--r--  1 root wheel 1384384 Aug 23 13:55 work/.build/utilities/CMakeFiles/perror.dir/perror.cc.o
The difference is subtle, but don't miss it - it's exactly twenty minutes later, at 13:55 instead of 13:35.

So - that's it. I'm faced with this bizzare problem. I don't know how to proceed. I know there's some wisdom to "all's well that ends well" but I really am not looking forward to not knowing every time I start major build from ports if one or more processes is going to get "stuck" for hours on end. Race condition / spin lock on creating files - file system bug? It's got to be something really strange like that, but I'm stumped.
 

Attachments

  • cxx_stuck.png
    cxx_stuck.png
    38.1 KB · Views: 237
  • htop_cxx_stuck.png
    htop_cxx_stuck.png
    119.3 KB · Views: 235
You didn't mention anything about your disk setup here.

Plus are you using TempFS? Not much RAM on those boards. They need it or some accommodation.
 
One system is using TempFS and one isn't. Please note that I said that both RAM and swap are fine, as you can verify from the htop screen shot. The "disk" is a micro SD card as is standard for RPIs. But I didn't really feel that is relevant, as vmstat shows NO disk activity at all when the compiler is "stuck" and the system is otherwise idle. And there's the really big issue - when it was stuck, it ran up over 2 hours of CPU time for a compile which, when run alone, took less than 7 seconds and only just over 8.4 real time, so it's clearly not IO bound. Unless you think there might be a race condition in TempFS?
 
Maybe your microSD card is barfing.
Have you monitored via another VT with gstat ?

I add a USB3 stick for /src and /ports when I compiled on RPi3A.
Increased TempFS sizes. They only used 512MB on those. 1GB is obviously better.

I tried to compile ports once to microSD on BBB. I think its still at work....
 
How would I tell if the MicroSD card is not working right? There's nothing in dmesg or messages. And when I stop the process and restart it, it's not like I have to reboot or experience any system instability. I should have mentioned, I'm NOT using an X11 kernel on this, so I have an OK amount of RAM for what Im doing since I have 1Gb of RAM. Since the CPU load remains at almost 400% nearly 100% of the time until it gets stuck (well, and after, but that's not really my point), I think that the IO versus CPU balance must be nearly ideal. A USB stick is theoretically faster, but if I'm already maxing out the CPU when things are working right, I think any advantage would be minima. I have not used gstat, though I am monitoring the system via ssh from my laptop. If you feel gstat will provide some additional insight, I'll definitely look into it. I don't need to compile ALL the ports - just some. I once thought about compiling kernel, but, well...

Should I reconfigure it to not use TempFS? It's not clear to me if you are recommending it or prefering that I avoid it?

Code:
% df -m
Filesystem       1M-blocks  Used Avail Capacity  Mounted on
/dev/ufs/rootfs      27754 15775  9758    62%    /
devfs                    0     0     0     0%    /dev
/dev/msdosfs/EFI        49    25    24    50%    /boot/efi
tmpfs                 1917     0  1917     0%    /tmp
 
I have an OK amount of RAM for what Im doing since I have 1Gb of RAM
I’m not sure that is true for something like compiling MySQL 8 but I don’t think related to your problem.

It might be that your MicroSD card is going very very very slowly at certain points but not causing an error. Not sure how best to prove that - have you got another card you could try (obviously not a quick way to find out!)
 
gstat in another VT terminal window or another SSH session while compiling.

Look for the pretty colors. Green is good. Red is bad.
 
Run top, not htop, as it provides some more information. You can also run "iostat 3" or something to see how much i/o is done.

Note that larger tmpfs won't necessarily help you.

See if things improve if you use gcc, not clang (the default cc). pkg install gcc (not build it locally)!

I compile hardly any ports locally but I guess everyone has to go through wasting a lot of time building ports before deciding on this :-)
 
Oops. OK. I see I didn't adequately describe the situation. Before anything gets stuck, the system looks very resource balanced. The build processes keep all four CPUs almost exactly at 100%. That is not what an IO bound system looks like. When I'm doing the "dd" to create a new bootable image for example, I definitely see what the system looks like when it is waiting for IO, and this isn't it. Besides, after the compete processes complete, the "stuck" proces does not continue. Then, after the first process gets "stuck", the build continues driving other work, still keeping the CPUs busy, until the dependencies can no longer be resolved. The same is true if/when other processes get "stuck". It doesn't matter if the "stuck" process is suspended or continues. When suspended, the CPUs are about 3/4 busy each, as you'd expect.

As for the tmpfs, I failed to notice that. It just never occurred to me that it would be an unreasonable value like that. I don't know where that came from. The fstab doesn't have a size parameter for it. Is there a new feature that automatically increases the size when needed or something? The bug referenced would suggest not. But maybe this is somehow triggering the problem. The man page says that things can get swapped out from tmpfs, but that seems like you might just as well use the buffer pool instead. I don't really get the point of tmpfs anyway - a regular filesystem will still use the cache buffer pool. How about I build a system image that doesn't use tmpfs at all? That's my usual approach anyway - I was just creating this environment as "vanilla" as possible for tracking down the bug that started all this. I don't want to change too many variables at once, and my goal is to find the underlying problem, since I've both managed to compile it myself by INT and restarting, and having one of the developers compile it for me. I don't want to change too much at once, but I'll create a bootable image that doesn't use tmpfs at all - just a regular file system - and we'll see what happens with that.

I feel more and more like maybe we're onto something here. I wonder if we have a "deadly embrace" spin lock condition that's getting tripped by having a tmpfs that could get paged out. There is a little bit of swapping that occurs during the build process, so...

Anybody know where that crazy tmpfs size value came from?

As for building ports locally, I was only doing this because of a bug that caused SIGILL in the database server during start up on my architectue. The bug has been fixed, but the new versions of the software with the fix have not been released. I'm not doing this for fun, but now that I've uncovered the problem, I'd really like to understand what's happening. Plus, there's clearly a bug somewhere and it might be generally beneficial to find and fix it.
 
Well, it's been an interesting few days, to be sure. Abstract: I built a new boot image that did not use tmpfs and which used an explicit swap partition rather than the growfs calculated swap, and I built mysqld80-server from ports on a RPI3B+ without observing ANY "stuck" processes - the phenomenon where a process would just sit and spin consuming CPU but driving no IO and causing no paging did not occur even once. For whatever that tells us about the "stuck process" phenomenon - my gut says there's a spin lock race condition in tmpfs, but I don't have much in the way of evidence to prove it.

Having said all that, I will concede the point - this system is NOT POWERFUL ENOUGH to practically compile the larger ports. I succeeded, but it wasn't easy, and there were definitely bumps along the way.

Here's my fstab and swapinfo and df:
Code:
/% cat /etc/fstab 
dev/ufs/rootfs             /              ufs     rw              1       1
/dev/msdosfs/EFI       /boot/efi    msdosfs rw,noatime      0       0
#tmpfs                          /tmp           tmpfs   rw,mode=1777    0       0
/dev/label/casptmp     /tmp          ufs     rw      2       2
/dev/mmcsd0s3a       none         swap    sw      0       0
% swapinfo 
Device          1M-blocks     Used    Avail Capacity
/dev/mmcsd0s3a       3600       12     3587     0%
% df -m
Filesystem         1M-blocks  Used Avail Capacity  Mounted on
/dev/ufs/rootfs        20816 11831  7319    62%    /
devfs                      0     0     0     0%    /dev
/dev/msdosfs/EFI          49    25    24    50%    /boot/efi
/dev/label/casptmp      5279     0  4857     0%    /tmp
Yes, I know - I went way overboard with the size of tmp - but I didn't catch the mistake until I'd already created the image, so I left it. No harm. The swap size is based on being told at boot time with an earlier version of FreeBSD that the most swap it would use on these machines is like 3608Mb, so I just rounded that. I monitored the system with top/htop and "gstat -f mmcsd0\$". Because I'm experimenting with active cooling, I also monitored the CPU frequency and core temps, but I don't think that's relevant to this discussion, except to say it never got hot enough to have to step down the frequency.

FOR THE MOST PART, this went really well. Most of the time, there were four compiles going each using nearly 100% of the CPU, while the SD was reported as only a few percent busy or less and usually there was only about 40M in swap and physical memory was often at 70% utilization or less. One exception was whenever it was gunzipping something - then the CPU utilization of the associated process fell and gstat would report that device was from 85%-190% busy (I used to work for EMC - I understand how device busy calculations can end up reporting more than 100%). Another exception would be when we started paging heavily - then I would see the CPU utilization drop and the device busy get high again for a few seconds - but eventually the processes that were big memory consumers would complete, and things would go back to 100% CPU on all four cores with ony a few percent or less busy on the device.

That was typical, and exactly what I would have expected from this environment, but that's not all that happened. Toward the end, it hit a bunch of big compiles. As long as I had only one heavy memory user, things would work their way through before too long. But in this case, swap kept growing and growing and the CPU utilization kept shrinking and shrinking. We actually got to 1.25Gb of swap in use (with 926Mb of available physical memory) and it was just paging insanely - the device utilization stayed pegged above 90% while the CPU utilization was in the single digits - if I didn't do something, at that rate, it would still be compiling by next weekend - so I picked the process with the biggest RESMEM and suspended it - which immediately freed up all its physical memory and basically allowed it to be "rolled out". After a few seconds or reallocating resources, the average CPU utilization bounced back to near 75% and I just let things stay that way unil it worked its way through this really intense part. Eventually, everything came to a halt waitng for the suspended process to complete so I allowed it to continue, so everything fired up again. I had to do that about 3 or 4 times or it would have just thrashed for days.

So - that last phenomenon is just trying to do this on a machine that is too small and I accept that as being the result of choices I have made (but hey, I have a rack of "servers" that only cost me $35 each). The next part is where things really go off the rails.

Every once in a while, when the system was busy, but not that last scenario I described wih the massive paging - it would stop on an error. /var/log/messages would say:
Code:
Aug 25 19:40:34 casper kernel: pid 33690 (c++), jid 0, uid 0, was killed: failed to reclaim memory
Aug 26 00:13:53 casper kernel: pid 47021 (c++), jid 0, uid 0, was killed: failed to reclaim memory
Aug 26 07:58:25 casper kernel: pid 50699 (c++), jid 0, uid 0, was killed: failed to reclaim memory
Aug 26 12:21:45 casper kernel: pid 8629 (c++), jid 0, uid 0, was killed: failed to reclaim memory
Aug 26 13:19:31 casper kernel: pid 11647 (c++), jid 0, uid 0, was killed: failed to reclaim memory
Aug 26 13:19:43 casper kernel: pid 11653 (c++), jid 0, uid 0, was killed: failed to reclaim memory
Aug 26 15:06:06 casper kernel: pid 14651 (c++), jid 0, uid 0, was killed: failed to reclaim memory
Aug 26 15:22:29 casper kernel: pid 17158 (c++), jid 0, uid 0, was killed: failed to reclaim memory
Aug 26 15:25:57 casper kernel: pid 19428 (c++), jid 0, uid 0, was killed: failed to reclaim memory
Aug 26 16:26:47 casper kernel: pid 22652 (c++), jid 0, uid 0, was killed: failed to reclaim memory
make would stop, but I would just start it up again and it would pick up right where it left off. Sometimes this would happen whie I was actively monitoring the system, and I would see nothing that to me indicated trouble. I have no idea what "failed to reclaim memory means - and given that I compiled 8.4 on a system with only 1.9Gb of swap while this one has 3.6Gb of swap space, I don't think it was vmem starvation. And here's the thing that really makes my head spiin - during all those hours when the "big hitter" processes werre running - this NEVER HAPPENED - not even once. During the whole six hours the system was paging and choking on the big workloads, it just kept going without ever throwing the above errors.

Just to be clear - I didn't just compile and install mysqld - I loaded up one of my databases and ran some reports off it, so I know it's actually working.

So - was this last case the same situation that predicated the "stuck" process scenario, but because of the different configuration, behaved differently? Is there some pernicious problem just lurking in the code to bite me when I least expect it? I don't know! And what's more, I don't know how to find out. I am out of ideas on how to move this forward. I am open to suggestions on this, but now I need to get back to the thing I was actually working on when this whole situation arose.
 
I’ve tried to go down the “odd things happen on a resource-starved machine“ rabbit hole a few times but always give up and upgrade (in the Pi case means a new machine I guess).

Good luck!
 
I appreciate that perspective. This is as far as I can go with SUPPORTED passive cooling solutions. I may just have to switch over to RPI4s with 4GB RAM and see if I can't still work out a passive cooling solution. I actually did it with my entertainment center RPI4 - I ripped 112 DVDs over the course of a number of days and stayed just below the thermal backdown point with passive cooling. But you're right - if these are just the odd things that happen in a resouce starved environment, there's probably no broader benefit to pursuing it. These little guys do an amazing job for me most of the time, though. I'm a little shy of active cooling because I've gone through more than my fair share of fans.
 
It is interesting though that for the six hours it was under the most pressure, with more VMEM in swap than physical RAM, it performed exactly as one could expect.
 
I still don't know what "failed to reclaim memoy" means
It means a process needs more memory but the system couldn't find enough. It would try to free up some memory by killing random processes (not sure how it chooses its "victim" process to kill). If you do "ps xl" you will see a column labelled RSS. That is the resident set size -- the number of pages that are actively in use by a process.

Typically C++ compilers are real memory hogs (and I think clang++|llvm much more so than gcc++). If you use tmpfs, there are fewer physical pages for everyone else. Basically compiling large C++ programs on machine with 1GB of RAM is always going to be painful (and/or may fail due to a lack of memory).
 
Back
Top