Hi folks,
I suspect my hardware (10 year old Intel NUC Gen 6) might be failing so taking these two recent crashes with a pinch of salt.
In less than 24h I had two kernel crashes with automatic reboot, on a hardware that had been working 24x7 for years now.
First crash was about 3h up after a power cycle:
The second crash happened about 15 hours after the first but it hasn't generated any information why. No core dump, which makes me suspect hardware.
System itself is very basic, bunch of jails running, no X.
Vanilla kernel, patched to 15.0-RELEASE-p2 Two ZFS pools (one SSD, one NVMe) plus an USB-attached UFS device mounted. Jails accessing various mountpoints with nullfs.
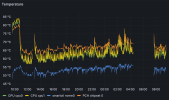
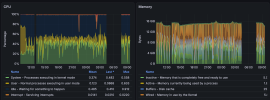
Monitoring wise, there's no indication of pressure. CPU was half idle, memory within normal usage (those spikes are ugly but within reason).
What other suggestions would you have on how to continue troubleshooting this?
Thanks
I suspect my hardware (10 year old Intel NUC Gen 6) might be failing so taking these two recent crashes with a pinch of salt.
In less than 24h I had two kernel crashes with automatic reboot, on a hardware that had been working 24x7 for years now.
First crash was about 3h up after a power cycle:
Code:
Feb 10 13:02:38 hostname syslogd: last message repeated 1 times
Feb 10 13:02:38 hostname kernel: [12409] Fatal trap 12: page fault while in kernel mode
Feb 10 13:02:38 hostname kernel: [12409] cpuid = 0; apic id = 00
Feb 10 13:02:38 hostname kernel: [12409] fault virtual address  = 0x400030
Feb 10 13:02:38 hostname kernel: [12409] fault code             = supervisor read data, page not present
Feb 10 13:02:38 hostname kernel: [12409] instruction pointer    = 0x20:0xffffffff80ed33bd
Feb 10 13:02:38 hostname kernel: [12409] stack pointer          = 0x28:0xfffffe00ef4a6d30
Feb 10 13:02:38 hostname kernel: [12409] frame pointer          = 0x28:0xfffffe00ef4a6d50
Feb 10 13:02:38 hostname kernel: [12409] code segment           = base 0x0, limit 0xfffff, type 0x1b
Feb 10 13:02:38 hostname kernel: [12409]                        = DPL 0, pres 1, long 1, def32 0, gran 1
Feb 10 13:02:38 hostname kernel: [12409] processor eflags       = interrupt enabled, resume, IOPL = 0
Feb 10 13:02:38 hostname kernel: [12409] current process                = 16 (/mnt/6TB-geli-ufs w)
Feb 10 13:02:38 hostname kernel: [12409] rdi: 0000000000000000 rsi: fffff8015ac4d700 rdx: fffff801d5a42200
Feb 10 13:02:38 hostname kernel: [12409] rcx: 0000000000000000  r8: 0000000000000020  r9: 0000000000000000
Feb 10 13:02:38 hostname kernel: [12409] rax: fffff801c566d030 rbx: fffff8015ac4da00 rbp: fffffe00ef4a6d50
Feb 10 13:02:38 hostname kernel: [12409] r10: 000000000000003e r11: fffff801d5a42200 r12: fffff80005da2400
Feb 10 13:02:38 hostname kernel: [12409] r13: 0000000000000000 r14: 0000000000400000 r15: 0000000000000800
Feb 10 13:02:38 hostname kernel: [12409] trap number            = 12
Feb 10 13:02:38 hostname kernel: [12409] panic: page fault
Feb 10 13:02:38 hostname kernel: [12409] cpuid = 0
Feb 10 13:02:38 hostname kernel: [12409] time = 1770727394
Feb 10 13:02:38 hostname kernel: [12409] KDB: stack backtrace:
Feb 10 13:02:38 hostname kernel: [12409] #0 0xffffffff80bbe1ed at kdb_backtrace+0x5d
Feb 10 13:02:38 hostname kernel: [12409] #1 0xffffffff80b71576 at vpanic+0x136
Feb 10 13:02:38 hostname kernel: [12409] #2 0xffffffff80b71433 at panic+0x43
Feb 10 13:02:38 hostname kernel: [12409] #3 0xffffffff81079f69 at trap_pfault+0x3c9
Feb 10 13:02:38 hostname kernel: [12409] #4 0xffffffff8104ffe8 at calltrap+0x8
Feb 10 13:02:38 hostname kernel: [12409] #5 0xffffffff80ed3426 at free_newblk+0x156
Feb 10 13:02:38 hostname kernel: [12409] #6 0xffffffff80ec71a8 at handle_workitem_freeblocks+0x88
Feb 10 13:02:38 hostname kernel: [12409] #7 0xffffffff80ec04c0 at process_worklist_item+0x1e0
Feb 10 13:02:38 hostname kernel: [12409] #8 0xffffffff80ebaddd at softdep_process_worklist+0xed
Feb 10 13:02:38 hostname kernel: [12409] #9 0xffffffff80ebea6f at softdep_flush+0x11f
Feb 10 13:02:38 hostname kernel: [12409] #10 0xffffffff80b2786b at fork_exit+0x7b
Feb 10 13:02:38 hostname kernel: [12409] #11 0xffffffff8105100e at fork_trampoline+0xe
Feb 10 13:02:38 hostname kernel: [12409] Uptime: 3h26m49s
Feb 10 13:02:38 hostname kernel: [12409] Dumping 1658 out of 16104 MB:..1%..11%..21%..31%..41%..51%..61%..71%..81%..91%
savecore saved the swap0 memory on /var/crash/vmcore.0 but unfortunately my swap partition is just 2GB so it doesn't cover the entire 16GB RAM.The second crash happened about 15 hours after the first but it hasn't generated any information why. No core dump, which makes me suspect hardware.
System itself is very basic, bunch of jails running, no X.
Vanilla kernel, patched to 15.0-RELEASE-p2 Two ZFS pools (one SSD, one NVMe) plus an USB-attached UFS device mounted. Jails accessing various mountpoints with nullfs.
Monitoring wise, there's no indication of pressure. CPU was half idle, memory within normal usage (those spikes are ugly but within reason).
What other suggestions would you have on how to continue troubleshooting this?
Thanks