
Hi,
Shared web host with a few dozen websites and PHP FPM pools. Recently upgraded from FreeBSD 12 to 15. I have noticed that what recently seems to be a pattern of the web serving effectively going down every other day at 3 AM.
Graph from VMware:
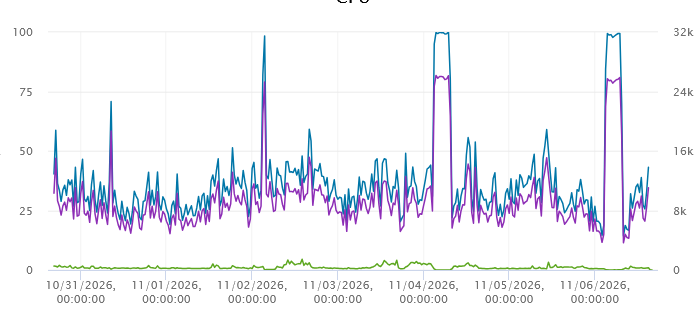
I've ended up rebooting (when I wake up) to get it operational. I've not had a lot of time to troubleshoot while it's going on. The shell is noticably slower during. I tried restarting Apache, PHP-FPM and MySQL with no change.
I did find these processes running: (this is nearly four hours later)
And apparently of note is the 58 locked processes and states listed here: (the PHP-FPM pool CPU usage is about normal for the server, except perhaps for the www pool) On a working system, the states are mostly
Shared web host with a few dozen websites and PHP FPM pools. Recently upgraded from FreeBSD 12 to 15. I have noticed that what recently seems to be a pattern of the web serving effectively going down every other day at 3 AM.
Graph from VMware:
I've ended up rebooting (when I wake up) to get it operational. I've not had a lot of time to troubleshoot while it's going on. The shell is noticably slower during. I tried restarting Apache, PHP-FPM and MySQL with no change.
I did find these processes running: (this is nearly four hours later)
Code:
root                    80784  16.5  0.1   38720   28476  -  R    03:01      49:02.47 / /var/mail /usr/home /var/db/mysql /backup /usr/src /usr/local /dev
root                    80587   0.0  0.0   14300    2808  -  I    03:01       0:00.00 cron: running job (cron)
root                    80589   0.0  0.0   14764    3188  -  Is   03:01       0:00.00 /bin/sh - /usr/sbin/periodic daily
root                    80593   0.0  0.0   14088    2436  -  I    03:01       0:00.00 lockf -s -t 0 /var/run/periodic.daily.lock /bin/sh /usr/sbin/periodi
root                    80594   0.0  0.0   14764    3172  -  I    03:01       0:00.00 /bin/sh /usr/sbin/periodic LOCKED daily
root                    80604   0.0  0.0   14764    3184  -  I    03:01       0:00.01 /bin/sh /usr/sbin/periodic LOCKED daily
root                    80605   0.0  0.0   16648    2584  -  I    03:01       0:00.00 cat
root                    80754   0.0  0.0   14764    3184  -  I    03:01       0:00.00 /bin/sh /etc/periodic/daily/450.status-security
root                    80757   0.0  0.0   14764    3172  -  I    03:01       0:00.00 /bin/sh - /usr/sbin/periodic security
root                    80761   0.0  0.0   14088    2440  -  I    03:01       0:00.00 lockf -s -t 0 /var/run/periodic.security.lock /bin/sh /usr/sbin/peri
root                    80762   0.0  0.0   14764    3172  -  I    03:01       0:00.00 /bin/sh /usr/sbin/periodic LOCKED security
root                    80771   0.0  0.0   14764    3180  -  I    03:01       0:00.00 /bin/sh /usr/sbin/periodic LOCKED security
root                    80772   0.0  0.0   16648    2580  -  I    03:01       0:00.00 cat
root                    80777   0.0  0.0   14764    3180  -  I    03:01       0:00.00 /bin/sh - /etc/periodic/security/110.neggrpperm
root                    80783   0.0  0.0   14764    3172  -  I    03:01       0:00.00 /bin/sh - /etc/periodic/security/110.neggrpperm
root                    80785   0.0  0.0   14084    2436  -  IC   03:01       0:00.00 tee /dev/stderr
root                    80786   0.0  0.0   14560    3024  -  IC   03:01       0:00.00 wc -l
And apparently of note is the 58 locked processes and states listed here: (the PHP-FPM pool CPU usage is about normal for the server, except perhaps for the www pool) On a working system, the states are mostly
accept or CPUN.
Code:
```
last pid:  7297;  load averages:   86.32,   80.30,   77.17                                                                         up 2+03:40:21  07:40:50
765 processes: 113 running, 594 sleeping, 58 lock
CPU:  2.2% user,  0.0% nice, 95.6% system,  0.0% interrupt,  2.2% idle
Mem: 8907M Active, 9971M Inact, 11G Wired, 9331M Free
ARC: 8177M Total, 4943M MFU, 1459M MRU, 3425K Anon, 172M Header, 1475M Other
     5174M Compressed, 11G Uncompressed, 2.17:1 Ratio
Swap: 4096M Total, 4096M Free

  PID USERNAME    THR PRI NICE   SIZE    RES STATE    C   TIME    WCPU COMMAND
 1619 www           1  39    0   199M    41M accept   2   3:15  75.65% php-fpm
 6682 utecab        1  89    0   222M    70M RUN      1   0:09  31.58% php-fpm
 6226 kellos        1  87    0   212M   167M RUN      0   0:09  21.05% php-fpm
 7252 fargelanda    1  88    0   201M    42M RUN      4   0:01  17.02% php-fpm
 5685 trollhatta    1  88    0   226M    65M *vnode   3   0:09  16.05% php-fpm
 3444 smjusterin    1  89    0   256M    96M RUN      3   0:20  15.83% php-fpm
33037 svarteborg    1  87    0   298M   140M RUN      4   6:26  15.50% php-fpm
 4990 klasjansso    1  87    0   242M    81M RUN      4   0:14  12.63% php-fpm
 5358 alstor        1  86    0   234M    73M RUN      1   0:11  12.62% php-fpm
 7220 bostadsbut    1  87    0   201M    42M RUN      0   0:01  11.77% php-fpm
 4662 utecab        1  86    0   246M    94M *vdbat   0   0:14  11.39% php-fpm
59595 svarteborg    1  86    0   256M    98M RUN      6   4:19  10.97% php-fpm
 3617 kellos        1  87    0   242M   198M RUN      6   0:22  10.95% php-fpm
 5589 konsensus     1  87    0   246M    84M RUN      1   0:11  10.91% php-fpm
 5463 klasjansso    1  86    0   228M    68M RUN      6   0:11  10.74% php-fpm
 2910 trollhatta    1  87    0   280M   113M *vnode   4   0:23  10.63% php-fpm
 6584 cckakel       1  87    0   220M    59M RUN      1   0:05  10.62% php-fpm
 6784 franchiset    1  87    0   220M    59M RUN      1   0:04  10.53% php-fpm
 5376 brion         1  86    0   248M    86M RUN      6   0:12  10.51% php-fpm
 5962 brion         1  86    0   234M    73M RUN      1   0:10  10.47% php-fpm
 2327 utecab        1  87    0   274M   121M RUN      6   0:25  10.34% php-fpm
31538 svarteborg    1  87    0   309M   143M RUN      0   6:52   8.82% php-fpm
 5879 jsrentrepr    1  88    0   232M   133M RUN      3   0:11   8.56% php-fpm
 4491 klasjansso    1  86    0   248M    87M *vdbat   7   0:17   8.10% php-fpm
74316 svarteborg    1  87    0   282M   125M RUN      6   2:51   7.37% php-fpm
 5017 klasjansso    1  87    0   252M    90M RUN      1   0:14   7.33% php-fpm
 5922 brion         1  86    0   224M    63M CPU2     2   0:09   6.92% php-fpm
 4653 surfacebyg    1  86    0   262M   103M *vdbat   0   0:15   6.88% php-fpm
58714 svarteborg    1  86    0   228M    70M RUN      3   4:25   5.81% php-fpm
 6968 bostadsbut    1  86    0   226M    65M RUN      6   0:04   5.74% php-fpm
 6773 utecab        1  86    0   224M    72M *vdbat   7   0:05   5.64% php-fpm
[...]

 That script seems to finish in about ten minutes, also. Nevertheless, I have disabled that job, for now.
