MariaDB jail keep crashing the server

Hi all,

We host all our client wordpress website on a Freebsd 12.0-RELEASE host and we put every client on a separate jail to keep them apart from each other.
Each webjail run /www/nginx and all webjail share 1x common /databases/mariadb101-server and 1x common nginx web proxy.

In the last couple of month, all our WordPress site had the following error
Code:
Error establishing a database connection
When this happen, we are unable to do anything on the server and the team at the datacenter have to do a cold reboot for us and everything is ok again.

This is happening every 3 to 4 weeks.
Today, we look at the error log but we couldn't really make head and tail of the issue so we are hoping someone here could help us get to the bottom of it.
the /var/log/messages has the following up to the point of reboot:
Code:
Sep 20 13:06:48 FreeBSD-node1 kernel: sonewconn: pcb 0xfffff8004ceac000: Listen queue overflow: 193 already in queue awaiting acceptance (36 occurrences)
Sep 20 13:07:50 FreeBSD-node1 kernel: sonewconn: pcb 0xfffff8004ceac000: Listen queue overflow: 193 already in queue awaiting acceptance (57 occurrences)
Sep 20 13:08:52 FreeBSD-node1 kernel: sonewconn: pcb 0xfffff8004ceac000: Listen queue overflow: 193 already in queue awaiting acceptance (41 occurrences)
Sep 20 13:09:52 FreeBSD-node1 kernel: sonewconn: pcb 0xfffff8004ceac000: Listen queue overflow: 193 already in queue awaiting acceptance (66 occurrences)
Sep 20 13:10:54 FreeBSD-node1 kernel: sonewconn: pcb 0xfffff8004ceac000: Listen queue overflow: 193 already in queue awaiting acceptance (36 occurrences)
Sep 20 13:11:54 FreeBSD-node1 kernel: sonewconn: pcb 0xfffff8004ceac000: Listen queue overflow: 193 already in queue awaiting acceptance (69 occurrences)
Sep 20 13:12:54 FreeBSD-node1 kernel: sonewconn: pcb 0xfffff8004ceac000: Listen queue overflow: 193 already in queue awaiting acceptance (86 occurrences)
Sep 20 13:13:41 FreeBSD-node1 cbsd[24331]: cbsdd: update remote inventory for 209.95.xx.x via loop_per_retrinv [10]
Sep 20 13:13:54 FreeBSD-node1 kernel: sonewconn: pcb 0xfffff8004ceac000: Listen queue overflow: 193 already in queue awaiting acceptance (70 occurrences)
Sep 20 13:14:54 FreeBSD-node1 kernel: sonewconn: pcb 0xfffff8004ceac000: Listen queue overflow: 193 already in queue awaiting acceptance (106 occurrences)
Sep 20 13:15:54 FreeBSD-node1 kernel: sonewconn: pcb 0xfffff80b4ddda000: Listen queue overflow: 193 already in queue awaiting acceptance (83 occurrences)
Sep 20 13:16:55 FreeBSD-node1 kernel: sonewconn: pcb 0xfffff80b4ddda000: Listen queue overflow: 193 already in queue awaiting acceptance (88 occurrences)
Sep 20 13:17:56 FreeBSD-node1 kernel: sonewconn: pcb 0xfffff8004ceac000: Listen queue overflow: 193 already in queue awaiting acceptance (80 occurrences)
Sep 20 13:18:56 FreeBSD-node1 kernel: sonewconn: pcb 0xfffff8004ceac000: Listen queue overflow: 193 already in queue awaiting acceptance (104 occurrences)
Sep 20 13:19:56 FreeBSD-node1 kernel: sonewconn: pcb 0xfffff8004ceac000: Listen queue overflow: 193 already in queue awaiting acceptance (138 occurrences)
The log for /var/db/mysql/mariadb.trinitech.co.uk.err is in pastbin bellow due to its size
https://pastebin.com/MjeJEH6b

Here is my entire config /var/db/mysql/my.cnf
Code:
[mysqld]
log-bin=mysql-bin
expire-logs-days=3
sync-binlog=1

# DATA STORAGE #
innodb_data_home_dir = /var/db/mysql-innodb
innodb_log_group_home_dir = /var/db/mysql-innodb-logs
# INNODB #
innodb-flush-method            = O_DIRECT

# UTF-8 encoding settings #
collation-server               = utf8_unicode_ci
init-connect                   ='SET NAMES utf8'
character-set-server           = utf8

Here is my /boot/loader.conf from the FreeBSD host:
Code:
# ZFS root boot config
zfs_load="YES"
opensolaris_load="YES"
fdescfs_load="YES"
nullfs_load="YES"

# load the lagg module
if_lagg_load="YES"

# Set zfs pool output to show the GPT id for each drive
kern.geom.label.disk_ident.enable="0"
kern.geom.label.gpt.enable="1"
kern.geom.label.gptid.enable="0"

# Pf firewall kernel modules, preload
pf_load="YES"
pflog_load="YES"

# Pf firewall kernel modules, preload
pf_load="YES"
pflog_load="YES"

# load the PF CARP module
if_carp_load="YES"

# load the uhid module
uhid_load="YES

# Jail resource limits
kern.racct.enable="1"

# Broadcom NetXtreme bce(4) kernel driver, preload
if_bce_load="YES"

# Advanced Host Controller Interface (AHCI)
ahci_load="YES"

# H-TCP Congestion Control for increase in speed
cc_htcp_load="YES"

# How many seconds to sit at the boot menu before booting the server.
autoboot_delay="-3"  # (default 10) seconds

# Disabling hostcache cachelimit
net.inet.tcp.hostcache.cachelimit="0"

# Interface Maximum Queue Length
net.link.ifqmaxlen="2048"  # (default 50)

# Enable the optimized version of soreceive() for stream (TCP) sockets.
net.inet.tcp.soreceive_stream="1"  # (default 0)

# Disable destructive dtrace
security.bsd.allow_destructive_dtrace=0

# Load Nginx Filter
accf_http_load="YES"
accf_data_load="YES"
aio_load="YES"

# Load module for CBSD
#vmm_load="YES"
#nmdm_load="YES"
#if_bridge_load="YES"
#if_tap_load="YES"
kern.racct.enable=1

From what I found on the internet it could be a network saturation but I am unsure.

Thank you all in advance
 
Judging from the length of time it takes for this to happen, and the impact when the problem occurs, this sounds like some resource starvation, e.g. running out of RAM. Are you keeping track of that with SNMP or some monitoring agent?

Also, you're using racct, so are you sure the jails themselves aren't bumping into any limits? This seems less likely as it seems every jail is experiencing the problem at the same time, but it might be worth checking.
 
Hi,

I have installed Zabbix and loaded the FreeBSD template.
What do I need to monitor in regard to my issue?
 
Start by watching memory and swap usage. I'd also limit ARC, the combination of MySQL/MariaDB and ZFS can cause memory starvation and each one starts battling for the available memory, which in turn can hang up the whole machine. You also need to have a closer look at MariaDB/MySQL memory usage (caches, etc). The default settings are not too bad but are 'standard' and don't fit everybody. There's no "one-size-fits-all". Have a look with databases/mysqltuner for some basic tuning suggestions.
 
SirDice How do I limit ARC?
I also installed the zfs template you made available on github and for some reason, I canot see any zfs io statistic.
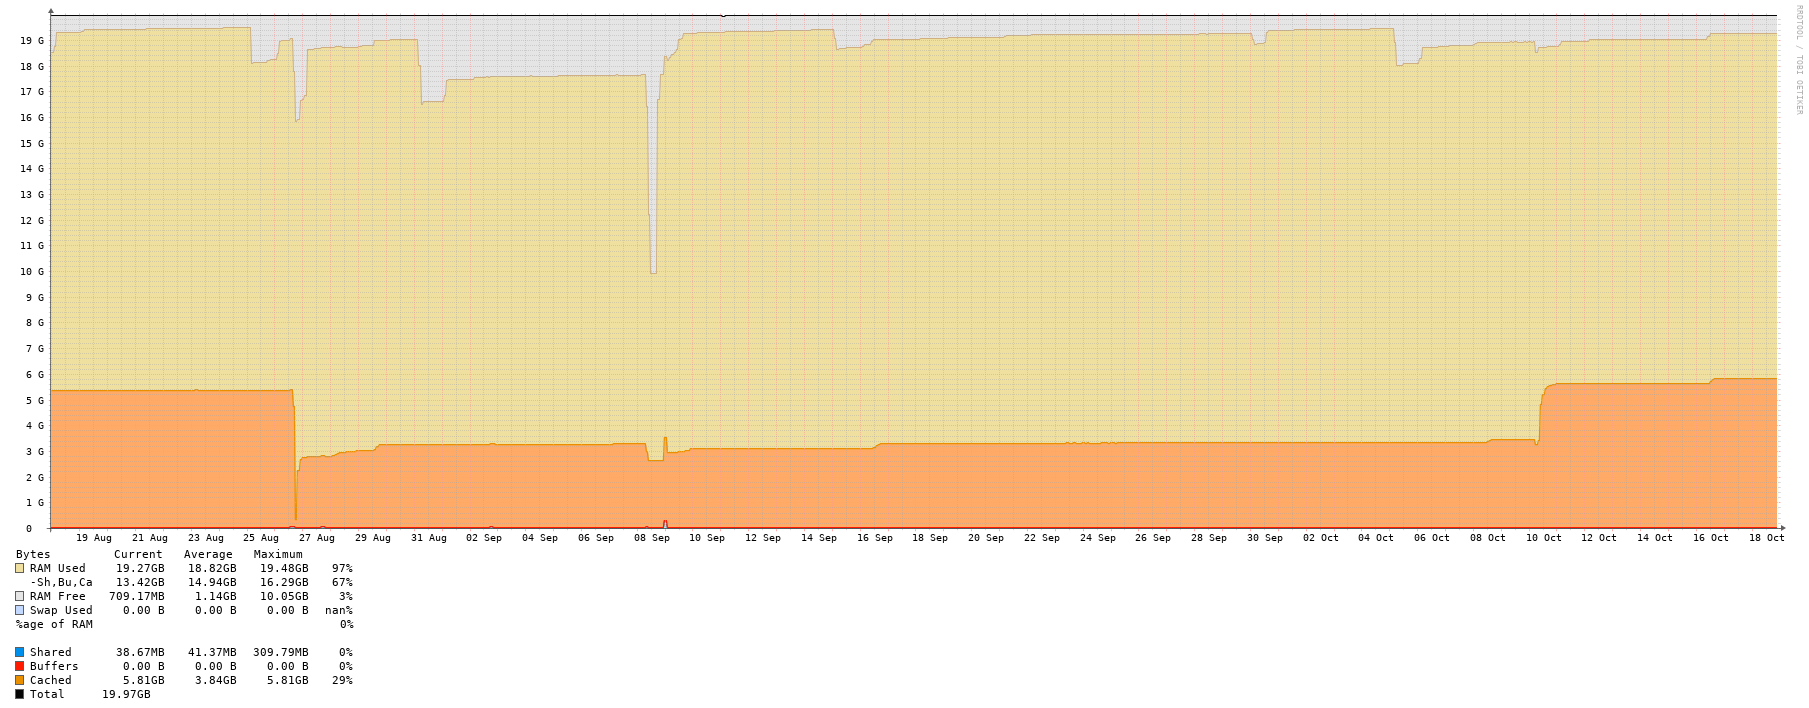
As far as RAM goes, it goes down very fast.
Here is a screenshot of the last 7 day the big spike on 16/10 is when I rebooted

How can I monitor MariaDB/MySQL memory usage when the MariaDB server in the jail. Zabbix is showing the hot data

Thank you
 
You can limit the ARC with a sysctl tunable. I'm not sure if this has to be done in /boot/loader.conf, but that's where I do it as I know it will work there. Here's an example from one of our servers:
Code:
vfs.zfs.arc_max="3G"
...to limit ARC to only 3GB of RAM.

As for zabbix, I'm not really sure, as we're using SNMP. If you instead decide to do go the SNMP route, and you're using bsnmpd(1), you'll want to install net-mgmt/bsnmp-ucd and enable it in the config to get memory usage information.
 
It's not simple. The main reason to limit ARC size is (or perhaps 'was', I know behavior is different in FreeBSD 12 and this might not be accurate any more) to leave enough free RAM for things that would rapidly allocate a large amount of RAM. These rapid allocations could occur faster than the ARC could be trimmed, resulting in the programs failing to allocate and almost invariably crashing at that point.

Since you're using racct, you should be able to determine a hard upper limit on total memory allocated, assuming you're limiting every jail. That said, this often isn't the most useful number, because:
  • Depending on the situation, you might deliberately overprovision the jails
  • Jails may use less than the limit they're assigned
  • If processes allocate memory slowly, limiting ARC isn't useful
  • While 'free' RAM is (mostly) wasted RAM, ARC gives diminishing returns as it gets more and more memory
  • Your environment may require more/less RAM to function with acceptable performance/stability and your performance/stability targets may be different from mine
The best way to set the ARC limit, IMHO, is this:
  1. Determine if ARC even needs to be limited in the first place. If you don't have applications/daemons being starved of memory, this won't solve the problem. The best way to do this is...
  2. ...collect data. It doesn't matter what you use, but use something that will give you a graph of memory usage over time. This should give you good baseline values for the amounts of memory you're using. (Note: ARC cache may not show up separately on these stats. Temporarily disable it or limit it to a small value and account for that value when looking at the stats.) Assuming you have rapid allocations causing programs to terminate, continue on to the next step.
  3. Take the maximum amount of RAM you think you'll ever use based on the data, and multiply it by some amount (e.g. 1.05 to give yourself 5% extra space) to give yourself a little headroom.
  4. Subtract this value from the total available memory. You can check hw.physmem or /var/run/dmesg.boot to get the total system memory.
  5. Limit the ARC to the result of the equation. Repeat starting at step 2 until you are satisfied.
To give a real world example, here's our bhyve server, which has its ARC limited to 3G after I did the steps I described above:
xvsxnd.png


That machine also has L2ARC, but the hit rate isn't that great. Even after the L2ARC is 'warm', it's only about 25%.
 
As far as i know ZFS is friendly enough to give away memory when an application asks for it.
Question : can you solve the problem not by rebooting but just by restarting only the database ?
 
  1. Determine if ARC even needs to be limited in the first place. If you don't have applications/daemons being starved of memory, this won't solve the problem. The best way to do this is...
  2. ...collect data. It doesn't matter what you use, but use something that will give you a graph of memory usage over time.
I use Zabbix and I can clearly see that the money go low very quickly. I just don't know where it all goes.
Take the maximum amount of RAM you think you'll ever use based on the data, and multiply it by some amount (e.g. 1.05 to give yourself 5% extra space) to give yourself a little headroom.

I really don't know how much the jail use or the host. I don't have a breakdown. I was hoping to achieve it in Zabbix but so far, I haven't managed.
I was hoping there was a rule of thunk :(
7057
 
mariadb:/root@[20:19] # mysqltuner
Code:
 >>  MySQLTuner 1.7.2 - Major Hayden <major@mhtx.net>
 >>  Bug reports, feature requests, and downloads at http://mysqltuner.com/
 >>  Run with '--help' for additional options and output filtering

[--] Skipped version check for MySQLTuner script
[OK] Currently running supported MySQL version 10.1.40-MariaDB
[OK] Operating on 64-bit architecture

-------- Log file Recommendations ------------------------------------------------------------------
[--] Log file: /var/db/mysql/mariadb.mydomain.co.uk.err(255M)
[OK] Log file /var/db/mysql/mariadb.mydomain.co.uk.err exists
[OK] Log file /var/db/mysql/mariadb.mydomain.co.uk.err is readable.
[OK] Log file /var/db/mysql/mariadb.mydomain.co.uk.err is not empty
[!!] Log file /var/db/mysql/mariadb.mydomain.co.uk.err is bigger than 32 Mb
[!!] /var/db/mysql/mariadb.mydomain.co.uk.err contains 488253 warning(s).
[!!] /var/db/mysql/mariadb.mydomain.co.uk.err contains 3805 error(s).
[--] 8 start(s) detected in /var/db/mysql/mariadb.mydomain.co.uk.err
[--] 1) 2019-10-18 19:19:04 34422751232 [Note] /usr/local/libexec/mysqld: ready for connections.
[--] 2) 2019-10-15 18:39:32 34422751232 [Note] /usr/local/libexec/mysqld: ready for connections.
[--] 3) 2019-10-15 11:52:00 34422751232 [Note] /usr/local/libexec/mysqld: ready for connections.
[--] 4) 2019-10-01  7:06:09 34422751232 [Note] /usr/local/libexec/mysqld: ready for connections.
[--] 5) 2019-09-20 12:44:48 34422751232 [Note] /usr/local/libexec/mysqld: ready for connections.
[--] 6) 2019-09-09 19:31:53 34422751232 [Note] /usr/local/libexec/mysqld: ready for connections.
[--] 7) 2019-08-07 14:38:46 34422751232 [Note] /usr/local/libexec/mysqld: ready for connections.
[--] 8) 2019-06-14 22:14:35 34422751232 [Note] /usr/local/libexec/mysqld: ready for connections.
[--] 4 shutdown(s) detected in /var/db/mysql/mariadb.mydomain.co.uk.err
[--] 1) 2019-10-18 19:12:21 34720152832 [Note] /usr/local/libexec/mysqld: Shutdown complete
[--] 2) 2019-10-15 18:33:09 34895621376 [Note] /usr/local/libexec/mysqld: Shutdown complete
[--] 3) 2019-10-01  6:58:44 34947860224 [Note] /usr/local/libexec/mysqld: Shutdown complete
[--] 4) 2019-08-07 14:38:45 34920651264 [Note] /usr/local/libexec/mysqld: Shutdown complete

-------- Storage Engine Statistics -----------------------------------------------------------------
[--] Status: +Aria +CSV +InnoDB +MEMORY +MRG_MyISAM +MyISAM +PERFORMANCE_SCHEMA +SEQUENCE
[--] Data in MyISAM tables: 18M (Tables: 65)
[--] Data in InnoDB tables: 6G (Tables: 4100)
[--] Data in MEMORY tables: 0B (Tables: 17)
[!!] Total fragmented tables: 2

-------- Security Recommendations ------------------------------------------------------------------
[OK] There are no anonymous accounts for any database users
[OK] All database users have passwords assigned
[!!] There is no basic password file list!

-------- CVE Security Recommendations --------------------------------------------------------------
[--] Skipped due to --cvefile option undefined

-------- Performance Metrics -----------------------------------------------------------------------
[--] Up for: 3d 1h 0m 4s (78M q [300.129 qps], 588K conn, TX: 1095G, RX: 14G)
[--] Reads / Writes: 94% / 6%
[--] Binary logging is enabled (GTID MODE: OFF)
[--] Physical Memory     : 47.9G
[--] Max MySQL memory    : 864.4M
[--] Other process memory: 1.6G
[--] Total buffers: 425.0M global + 2.9M per thread (151 max threads)
[--] P_S Max memory usage: 0B
[--] Galera GCache Max memory usage: 0B
[OK] Maximum reached memory usage: 622.9M (1.27% of installed RAM)
[OK] Maximum possible memory usage: 864.4M (1.76% of installed RAM)
[OK] Overall possible memory usage with other process is compatible with memory available
[OK] Slow queries: 0% (274/78M)
[OK] Highest usage of available connections: 45% (68/151)
[OK] Aborted connections: 0.00%  (0/588516)
[!!] name resolution is active : a reverse name resolution is made for each new connection and can reduce performance
[!!] Query cache may be disabled by default due to mutex contention.
[!!] Query cache efficiency: 0.0% (0 cached / 65M selects)
[OK] Query cache prunes per day: 0
[OK] Sorts requiring temporary tables: 0% (2 temp sorts / 10M sorts)
[!!] Joins performed without indexes: 305945
[!!] Temporary tables created on disk: 52% (5M on disk / 10M total)
[!!] Thread cache is disabled
[!!] Table cache hit rate: 0% (1K open / 524K opened)
[OK] Open file limit used: 2% (102/4K)
[OK] Table locks acquired immediately: 100% (103M immediate / 103M locks)
[OK] Binlog cache memory access: 99.99% (4063549 Memory / 4063759 Total)

-------- Performance schema ------------------------------------------------------------------------
[--] Performance schema is disabled.
[--] Memory used by P_S: 0B
[--] Sys schema isn't installed.

-------- ThreadPool Metrics ------------------------------------------------------------------------
[--] ThreadPool stat is enabled.
[--] Thread Pool Size: 24 thread(s).
[--] Using default value is good enough for your version (10.1.40-MariaDB)

-------- MyISAM Metrics ----------------------------------------------------------------------------
[!!] Key buffer used: 18.4% (24M used / 134M cache)
[OK] Key buffer size / total MyISAM indexes: 128.0M/2.1M
[OK] Read Key buffer hit rate: 99.6% (88K cached / 379 reads)
[!!] Write Key buffer hit rate: 64.3% (942 cached / 606 writes)

-------- InnoDB Metrics ----------------------------------------------------------------------------
[--] InnoDB is enabled.
[--] InnoDB Thread Concurrency: 0
[OK] InnoDB File per table is activated
[!!] InnoDB buffer pool / data size: 128.0M/6.1G
[!!] Ratio InnoDB log file size / InnoDB Buffer pool size (75 %): 48.0M * 2/128.0M should be equal 25%
[!!] InnoDB buffer pool <= 1G and Innodb_buffer_pool_instances(!=1).
[--] InnoDB Buffer Pool Chunk Size not used or defined in your version
[OK] InnoDB Read buffer efficiency: 99.95% (42343952629 hits/ 42364305404 total)
[!!] InnoDB Write Log efficiency: 37.32% (2307452 hits/ 6182818 total)
[OK] InnoDB log waits: 0.00% (0 waits / 3875366 writes)

-------- AriaDB Metrics ----------------------------------------------------------------------------
[--] AriaDB is enabled.
[OK] Aria pagecache size / total Aria indexes: 128.0M/1B
[OK] Aria pagecache hit rate: 99.1% (1B cached / 9M reads)

-------- TokuDB Metrics ----------------------------------------------------------------------------
[--] TokuDB is disabled.

-------- XtraDB Metrics ----------------------------------------------------------------------------
[--] XtraDB is disabled.

-------- RocksDB Metrics ---------------------------------------------------------------------------
[--] RocksDB is disabled.

-------- Spider Metrics ----------------------------------------------------------------------------
[--] Spider is disabled.

-------- Connect Metrics ---------------------------------------------------------------------------
[--] Connect is disabled.

-------- Galera Metrics ----------------------------------------------------------------------------
[--] Galera is disabled.

-------- Replication Metrics -----------------------------------------------------------------------
[--] Galera Synchronous replication: NO
[--] No replication slave(s) for this server.
[--] This is a standalone server.

-------- Recommendations ---------------------------------------------------------------------------
General recommendations:
    /var/db/mysql/mariadb.mydomain.co.uk.err is > 32Mb, you should analyze why or implement a rotation log strategy such as logrotate!
    Control warning line(s) into /var/db/mysql/mariadb.mydomain.co.uk.err file
    Control error line(s) into /var/db/mysql/mariadb.mydomain.co.uk.err file
    Run OPTIMIZE TABLE to defragment tables for better performance
      OPTIMIZE TABLE `sfk_live.sfk_mainwp_stream`; -- can free 55 MB
      OPTIMIZE TABLE `sfk_live.sfk_mainwp_stream_meta`; -- can free 137 MB
    Total freed space after theses OPTIMIZE TABLE : 192 Mb
    Configure your accounts with ip or subnets only, then update your configuration with skip-name-resolve=1
    Adjust your join queries to always utilize indexes
    When making adjustments, make tmp_table_size/max_heap_table_size equal
    Reduce your SELECT DISTINCT queries which have no LIMIT clause
    Set thread_cache_size to 4 as a starting value
    Increase table_open_cache gradually to avoid file descriptor limits
    Read this before increasing table_open_cache over 64: http://bit.ly/1mi7c4C
    Beware that open_files_limit (4206) variable
    should be greater than table_open_cache (2000)
    Performance should be activated for better diagnostics
    Consider installing Sys schema from https://github.com/mysql/mysql-sys
Variables to adjust:
    query_cache_size (=0)
    query_cache_type (=0)
    query_cache_limit (> 1M, or use smaller result sets)
    join_buffer_size (> 256.0K, or always use indexes with joins)
    tmp_table_size (> 16M)
    max_heap_table_size (> 16M)
    thread_cache_size (start at 4)
    table_open_cache (> 2000)
    performance_schema = ON enable PFS
    innodb_buffer_pool_size (>= 6G) if possible.
    innodb_log_file_size * innodb_log_files_in_group should be equal to 1/4 of buffer pool size (=64M) if possible.
    innodb_buffer_pool_instances (=1)
I just stopped the Database for 5 minutes, and saw about 5gb of ram that got freed.
7058

After complete reboot.. i obviouly got all ram back.
I ahve alos notice that a lot of ram go down around 4am.. which is when i do a zfs sent to offsite server.
Could that be the issue?
 
mariadb:/root@[20:19] # mysqltuner
Code:
 >>  MySQLTuner 1.7.2 - Major Hayden <major@mhtx.net>
 >>  Bug reports, feature requests, and downloads at http://mysqltuner.com/
 >>  Run with '--help' for additional options and output filtering

[--] Skipped version check for MySQLTuner script
[OK] Currently running supported MySQL version 10.1.40-MariaDB
[OK] Operating on 64-bit architecture

-------- Log file Recommendations ------------------------------------------------------------------
[--] Log file: /var/db/mysql/mariadb.mydomain.co.uk.err(255M)
[OK] Log file /var/db/mysql/mariadb.mydomain.co.uk.err exists
[OK] Log file /var/db/mysql/mariadb.mydomain.co.uk.err is readable.
[OK] Log file /var/db/mysql/mariadb.mydomain.co.uk.err is not empty
[!!] Log file /var/db/mysql/mariadb.mydomain.co.uk.err is bigger than 32 Mb
[!!] /var/db/mysql/mariadb.mydomain.co.uk.err contains 488253 warning(s).
[!!] /var/db/mysql/mariadb.mydomain.co.uk.err contains 3805 error(s).
[--] 8 start(s) detected in /var/db/mysql/mariadb.mydomain.co.uk.err
[--] 1) 2019-10-18 19:19:04 34422751232 [Note] /usr/local/libexec/mysqld: ready for connections.
[--] 2) 2019-10-15 18:39:32 34422751232 [Note] /usr/local/libexec/mysqld: ready for connections.
[--] 3) 2019-10-15 11:52:00 34422751232 [Note] /usr/local/libexec/mysqld: ready for connections.
[--] 4) 2019-10-01  7:06:09 34422751232 [Note] /usr/local/libexec/mysqld: ready for connections.
[--] 5) 2019-09-20 12:44:48 34422751232 [Note] /usr/local/libexec/mysqld: ready for connections.
[--] 6) 2019-09-09 19:31:53 34422751232 [Note] /usr/local/libexec/mysqld: ready for connections.
[--] 7) 2019-08-07 14:38:46 34422751232 [Note] /usr/local/libexec/mysqld: ready for connections.
[--] 8) 2019-06-14 22:14:35 34422751232 [Note] /usr/local/libexec/mysqld: ready for connections.
[--] 4 shutdown(s) detected in /var/db/mysql/mariadb.mydomain.co.uk.err
[--] 1) 2019-10-18 19:12:21 34720152832 [Note] /usr/local/libexec/mysqld: Shutdown complete
[--] 2) 2019-10-15 18:33:09 34895621376 [Note] /usr/local/libexec/mysqld: Shutdown complete
[--] 3) 2019-10-01  6:58:44 34947860224 [Note] /usr/local/libexec/mysqld: Shutdown complete
[--] 4) 2019-08-07 14:38:45 34920651264 [Note] /usr/local/libexec/mysqld: Shutdown complete

-------- Storage Engine Statistics -----------------------------------------------------------------
[--] Status: +Aria +CSV +InnoDB +MEMORY +MRG_MyISAM +MyISAM +PERFORMANCE_SCHEMA +SEQUENCE
[--] Data in MyISAM tables: 18M (Tables: 65)
[--] Data in InnoDB tables: 6G (Tables: 4100)
[--] Data in MEMORY tables: 0B (Tables: 17)
[!!] Total fragmented tables: 2

-------- Security Recommendations ------------------------------------------------------------------
[OK] There are no anonymous accounts for any database users
[OK] All database users have passwords assigned
[!!] There is no basic password file list!

-------- CVE Security Recommendations --------------------------------------------------------------
[--] Skipped due to --cvefile option undefined

-------- Performance Metrics -----------------------------------------------------------------------
[--] Up for: 3d 1h 0m 4s (78M q [300.129 qps], 588K conn, TX: 1095G, RX: 14G)
[--] Reads / Writes: 94% / 6%
[--] Binary logging is enabled (GTID MODE: OFF)
[--] Physical Memory     : 47.9G
[--] Max MySQL memory    : 864.4M
[--] Other process memory: 1.6G
[--] Total buffers: 425.0M global + 2.9M per thread (151 max threads)
[--] P_S Max memory usage: 0B
[--] Galera GCache Max memory usage: 0B
[OK] Maximum reached memory usage: 622.9M (1.27% of installed RAM)
[OK] Maximum possible memory usage: 864.4M (1.76% of installed RAM)
[OK] Overall possible memory usage with other process is compatible with memory available
[OK] Slow queries: 0% (274/78M)
[OK] Highest usage of available connections: 45% (68/151)
[OK] Aborted connections: 0.00%  (0/588516)
[!!] name resolution is active : a reverse name resolution is made for each new connection and can reduce performance
[!!] Query cache may be disabled by default due to mutex contention.
[!!] Query cache efficiency: 0.0% (0 cached / 65M selects)
[OK] Query cache prunes per day: 0
[OK] Sorts requiring temporary tables: 0% (2 temp sorts / 10M sorts)
[!!] Joins performed without indexes: 305945
[!!] Temporary tables created on disk: 52% (5M on disk / 10M total)
[!!] Thread cache is disabled
[!!] Table cache hit rate: 0% (1K open / 524K opened)
[OK] Open file limit used: 2% (102/4K)
[OK] Table locks acquired immediately: 100% (103M immediate / 103M locks)
[OK] Binlog cache memory access: 99.99% (4063549 Memory / 4063759 Total)

-------- Performance schema ------------------------------------------------------------------------
[--] Performance schema is disabled.
[--] Memory used by P_S: 0B
[--] Sys schema isn't installed.

-------- ThreadPool Metrics ------------------------------------------------------------------------
[--] ThreadPool stat is enabled.
[--] Thread Pool Size: 24 thread(s).
[--] Using default value is good enough for your version (10.1.40-MariaDB)

-------- MyISAM Metrics ----------------------------------------------------------------------------
[!!] Key buffer used: 18.4% (24M used / 134M cache)
[OK] Key buffer size / total MyISAM indexes: 128.0M/2.1M
[OK] Read Key buffer hit rate: 99.6% (88K cached / 379 reads)
[!!] Write Key buffer hit rate: 64.3% (942 cached / 606 writes)

-------- InnoDB Metrics ----------------------------------------------------------------------------
[--] InnoDB is enabled.
[--] InnoDB Thread Concurrency: 0
[OK] InnoDB File per table is activated
[!!] InnoDB buffer pool / data size: 128.0M/6.1G
[!!] Ratio InnoDB log file size / InnoDB Buffer pool size (75 %): 48.0M * 2/128.0M should be equal 25%
[!!] InnoDB buffer pool <= 1G and Innodb_buffer_pool_instances(!=1).
[--] InnoDB Buffer Pool Chunk Size not used or defined in your version
[OK] InnoDB Read buffer efficiency: 99.95% (42343952629 hits/ 42364305404 total)
[!!] InnoDB Write Log efficiency: 37.32% (2307452 hits/ 6182818 total)
[OK] InnoDB log waits: 0.00% (0 waits / 3875366 writes)

-------- AriaDB Metrics ----------------------------------------------------------------------------
[--] AriaDB is enabled.
[OK] Aria pagecache size / total Aria indexes: 128.0M/1B
[OK] Aria pagecache hit rate: 99.1% (1B cached / 9M reads)

-------- TokuDB Metrics ----------------------------------------------------------------------------
[--] TokuDB is disabled.

-------- XtraDB Metrics ----------------------------------------------------------------------------
[--] XtraDB is disabled.

-------- RocksDB Metrics ---------------------------------------------------------------------------
[--] RocksDB is disabled.

-------- Spider Metrics ----------------------------------------------------------------------------
[--] Spider is disabled.

-------- Connect Metrics ---------------------------------------------------------------------------
[--] Connect is disabled.

-------- Galera Metrics ----------------------------------------------------------------------------
[--] Galera is disabled.

-------- Replication Metrics -----------------------------------------------------------------------
[--] Galera Synchronous replication: NO
[--] No replication slave(s) for this server.
[--] This is a standalone server.

-------- Recommendations ---------------------------------------------------------------------------
General recommendations:
    /var/db/mysql/mariadb.mydomain.co.uk.err is > 32Mb, you should analyze why or implement a rotation log strategy such as logrotate!
    Control warning line(s) into /var/db/mysql/mariadb.mydomain.co.uk.err file
    Control error line(s) into /var/db/mysql/mariadb.mydomain.co.uk.err file
    Run OPTIMIZE TABLE to defragment tables for better performance
      OPTIMIZE TABLE `sfk_live.sfk_mainwp_stream`; -- can free 55 MB
      OPTIMIZE TABLE `sfk_live.sfk_mainwp_stream_meta`; -- can free 137 MB
    Total freed space after theses OPTIMIZE TABLE : 192 Mb
    Configure your accounts with ip or subnets only, then update your configuration with skip-name-resolve=1
    Adjust your join queries to always utilize indexes
    When making adjustments, make tmp_table_size/max_heap_table_size equal
    Reduce your SELECT DISTINCT queries which have no LIMIT clause
    Set thread_cache_size to 4 as a starting value
    Increase table_open_cache gradually to avoid file descriptor limits
    Read this before increasing table_open_cache over 64: http://bit.ly/1mi7c4C
    Beware that open_files_limit (4206) variable
    should be greater than table_open_cache (2000)
    Performance should be activated for better diagnostics
    Consider installing Sys schema from https://github.com/mysql/mysql-sys
Variables to adjust:
    query_cache_size (=0)
    query_cache_type (=0)
    query_cache_limit (> 1M, or use smaller result sets)
    join_buffer_size (> 256.0K, or always use indexes with joins)
    tmp_table_size (> 16M)
    max_heap_table_size (> 16M)
    thread_cache_size (start at 4)
    table_open_cache (> 2000)
    performance_schema = ON enable PFS
    innodb_buffer_pool_size (>= 6G) if possible.
    innodb_log_file_size * innodb_log_files_in_group should be equal to 1/4 of buffer pool size (=64M) if possible.
    innodb_buffer_pool_instances (=1)
I just stopped the Database for 5 minutes, and saw about 5gb of ram that got freed.
View attachment 7058
After complete reboot.. i obviouly got all ram back.
I ahve alos notice that a lot of ram go down around 4am.. which is when i do a zfs sent to offsite server.
Could that be the issue?
 
cat /etc/crontab
Code:
# /etc/crontab - root's crontab for FreeBSD
#
# $FreeBSD: releng/12.0/usr.sbin/cron/cron/crontab 338497 2018-09-06 14:55:54Z brd $
#
SHELL=/bin/sh
PATH=/sbin:/bin:/usr/sbin:/usr/bin:/usr/local/sbin:/usr/local/bin
#
#minute hour    mday    month   wday    who     command
#
# Save some entropy so that /dev/random can re-seed on boot.
*/11    *       *       *       *       operator /usr/libexec/save-entropy
#
# Rotate log files every hour, if necessary.
0       *       *       *       *       root    newsyslog
#
# Perform daily/weekly/monthly maintenance.
1       3       *       *       *       root    periodic daily
15      4       *       *       6       root    periodic weekly
30      5       1       *       *       root    periodic monthly
#
# Adjust the time zone if the CMOS clock keeps local time, as opposed to
# UTC time.  See adjkerntz(8) for details.
1,31    0-5     *       *       *       root    adjkerntz -a
crontab -l
Code:
SHELL=/bin/sh
PATH=/sbin:/bin:/usr/sbin:/usr/bin:/usr/local/sbin:/usr/local/bin:/usr/local/bin/bash

#
#minute (0-59)
#|   hour (0-23)
#|   |    day of the month (1-31)
#|   |    |   month of the year (1-12 or Jan-Dec)
#|   |    |   |   day of the week (0-6 with 0=Sun or Sun-Sat)
#|   |    |   |   |   commands
#|   |    |   |   |   |

# run the backup scripts at 4:30am
30   4    *   *   *   /bin/sh /root/myScripts/jailsync.sh  >> /var/log/myScripts/jailsync.sh 2>&1

# Automated ZFS backups (hourly):
0    *    *   *   *   /usr/local/bin/bash /root/myScripts/zfs-snapshot.sh zroot hourly 25
# Automated ZFS backups daily at 11:59pm (23:59)
59   23  *    *   *   /usr/local/bin/bash /root/myScripts/zfs-snapshot.sh zroot daily 8
# Automated ZFS backups weekly (Sunday at midnight)
00   0    *   *   0   /usr/local/bin/bash /root/myScripts/zfs-snapshot.sh zroot weekly 5
# Automated ZFS backups monthly (last day of the month)
59   23 28-31 *    *   [ $(date -j -v +1d +%d) -eq 1 ] && /usr/local/bin/bash /root/myScripts/zfs-snapshot.sh zroot monthly 13
7060


Based on the lastest above graph since rebooting last night, am I correct to see that I use about 35GB of RAM to run my applications and ZFS send?
Based on `Orum math:
Total available memory: 48GB
The maximum amount of RAM you think you'll ever use: 35 GB
48-(35*1.05) = 11.25
Should I be ok to set /boot/loader.conf to
Code:
vfs.zfs.arc_max="10G"
 
You will want to lower ARC even further and give MySQL/MariaDB more memory. You also need to fix a couple of tables.

Code:
[!!] InnoDB buffer pool / data size: 128.0M/6.1G
[!!] Ratio InnoDB log file size / InnoDB Buffer pool size (75 %): 48.0M * 2/128.0M should be equal 25%
[!!] InnoDB buffer pool <= 1G and Innodb_buffer_pool_instances(!=1).
Ideally you will want to give it enough memory so it can load the entire database in memory. The amount of data in the database is 6.1GB and you've given it 128MB (that's the default). So it's never going to perform very well.

Other important things:
Code:
    query_cache_size (=0)
    query_cache_type (=0)
If you have more than one CPU core you will need to turn off query cache, it doesn't work with SMP any way.

Code:
 join_buffer_size (> 256.0K, or always use indexes with joins)
This needs to be increased. Or add more indexes, or do both.

Code:
    tmp_table_size (> 16M)
    max_heap_table_size (> 16M)
    thread_cache_size (start at 4)
    table_open_cache (> 2000)
These can be increased too.
 
Old /var/db/my.cnf
Code:
[mysqld]
log-bin=mysql-bin
expire-logs-days=3
sync-binlog=1

# DATA STORAGE #
innodb_data_home_dir = /var/db/mysql-innodb
innodb_log_group_home_dir = /var/db/mysql-innodb-logs
# INNODB #
innodb-flush-method            = O_DIRECT

# UTF-8 encoding settings #
collation-server               = utf8_unicode_ci
init-connect                   ='SET NAMES utf8'
character-set-server           = utf8
New/var/db/my.cnf based on the above report:
Code:
[mysqld]
log-bin=mysql-bin
expire-logs-days=3
sync-binlog=1

# DATA STORAGE #
innodb_data_home_dir = /var/db/mysql-innodb
innodb_log_group_home_dir = /var/db/mysql-innodb-logs


# UTF-8 encoding settings #
collation-server               = utf8_unicode_ci
init-connect                   ='SET NAMES utf8'
character-set-server           = utf8

# InnoDB Settings
innodb-flush-method                = O_DIRECT
innodb_buffer_pool_instances    = 8
innodb_buffer_pool_size            = 8G
innodb_log_file_size            = 512M

thread_cache_size               = 4

# MyISAM Settings
query_cache_type               = 0
query_cache_size               = 0


# Buffer Settings
join_buffer_size                = 4M
read_buffer_size                = 3M
read_rnd_buffer_size            = 4M
sort_buffer_size                = 4M

# Table Settings
table_open_cache                = 10000
tmp_table_size                  = 128M
max_heap_table_size             = 128M
tmp_table_size                  = 128M

performance_schema                = ON enable PFS
With then
vfs.zfs.arc_max="6G"

Does this look more or less correct? Sorry for beginer questions..
 
Old /var/db/my.cnf
The default location is /var/db/mysql/my.cnf.

Does this look more or less correct?
Hard to tell. The trick about tuning is that it's a continuous process. Change some values, restart the database and leave it running for 2 days. Then run mysqltuner again, see if things improved. Change some more, let it run for 2 days, check again, etc. At the same time check your sites that use the database, are pages loading quickly, does it "feel" quick?

One thing to note, it's tempting to give MariaDB/MySQL a lot of memory, even if it doesn't need it. But this is actually bad for your performance. Large caches and buffers require processing overhead. The trick is to find the right balance between improving performance and the inevitable overhead.
 
Time will tell. Leave it running and check regularly. As I said, tuning is a continuous process.
 
Back
Top