Hi,
I have three FreeBSD servers in the same data centre, one of which I've noticed with the help of Munin has a non-zero amount of Input Errors. There server has been in operation since around Feb 2012 and I don't recall seeing any errors until around mid 2013 (when I upgraded to FreeBSD 9.1 from 9.0). The errors don't appear to be impacting the servers performance (it's a mail server but is also running MySQL for feed mail configuration to the other two servers in the data centre).
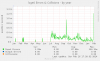
Yesterday I upgraded all three servers to FreeBSD 9.2 and have been monitoring the servers closely and I've noticed that Munin is reporting (graph attached) even higher Input Errors than previously so I thought I'd take a look into the problem.
Looking at the Munin plugin I can see it's running the following command...
and getting the following output
Munin only appears to be parsing the first line with the Link#1 in it. Ierrs is currently 799.
This post (http://serverfault.com/questions/122355 ... se-freebsd) suggested I should try the following...
Analyse:
[A lot of output, nothing useful as far as I could tell]
The line I found interesting was dev.bge.0.stats.rx.FramesTooLong: 799 as the value matched the Ierr value in the output of
Any help gratefully received!
Code:
FreeBSD navy.spectrumcs.net 9.2-RELEASE-p3 FreeBSD 9.2-RELEASE-p3 #0: Sat Jan 11 03:25:02 UTC 2014 root@amd64-builder.daemonology.net:/usr/obj/usr/src/sys/GENERIC amd64I have three FreeBSD servers in the same data centre, one of which I've noticed with the help of Munin has a non-zero amount of Input Errors. There server has been in operation since around Feb 2012 and I don't recall seeing any errors until around mid 2013 (when I upgraded to FreeBSD 9.1 from 9.0). The errors don't appear to be impacting the servers performance (it's a mail server but is also running MySQL for feed mail configuration to the other two servers in the data centre).
Yesterday I upgraded all three servers to FreeBSD 9.2 and have been monitoring the servers closely and I've noticed that Munin is reporting (graph attached) even higher Input Errors than previously so I thought I'd take a look into the problem.
Looking at the Munin plugin I can see it's running the following command...
Code:
/usr/bin/netstat -i -b -n -I bge0
Code:
Name    Mtu Network       Address              Ipkts Ierrs Idrop     Ibytes    Opkts Oerrs     Obytes  Coll
bge0   1400 <Link#1>      e4:1f:13:XX:XX:XX 21480728   799     0 3313781806 16682639     0 3836432749     0
bge0   1400 109.169.26.0/ 109.169.26.118    17933718     -     - 2844454533 17077923     - 3602874137     -
bge0   1400 fe80::e61f:13 fe80::e61f:13ff:f        0     -     -          0        1     -         96     -
Munin only appears to be parsing the first line with the Link#1 in it. Ierrs is currently 799.
This post (http://serverfault.com/questions/122355 ... se-freebsd) suggested I should try the following...
Analyse:
Code:
dmesg
sysctl dev.bce
vmstat -z (USED/LIMIT)
nestat -s (Errors/Buffers)
# dmesg | grep bge0
Code:
bge0: <Broadcom NetXtreme Gigabit Ethernet Controller, ASIC rev. 0x00a200> mem 0xe8200000-0xe820ffff irq 16 at device 0.0 on pci2
bge0: CHIP ID 0x0000a200; ASIC REV 0x0a; CHIP REV 0xa2; PCI-E
miibus0: <MII bus> on bge0
bge0: Ethernet address: e4:1f:13:XX:XX:XX
# sysctl dev.bge
Code:
dev.bge.0.%desc: Broadcom NetXtreme Gigabit Ethernet Controller, ASIC rev. 0x00a200
dev.bge.0.%driver: bge
dev.bge.0.%location: slot=0 function=0 handle=\_SB_.PCI0.EXP5.PXS5
dev.bge.0.%pnpinfo: vendor=0x14e4 device=0x165a subvendor=0x1014 subdevice=0x0378 class=0x020000
dev.bge.0.%parent: pci2
dev.bge.0.forced_collapse: 0
dev.bge.0.msi: 1
dev.bge.0.forced_udpcsum: 0
dev.bge.0.stats.FramesDroppedDueToFilters: 0
dev.bge.0.stats.DmaWriteQueueFull: 0
dev.bge.0.stats.DmaWriteHighPriQueueFull: 0
dev.bge.0.stats.NoMoreRxBDs: 0
dev.bge.0.stats.InputDiscards: 0
dev.bge.0.stats.InputErrors: 800
dev.bge.0.stats.RecvThresholdHit: 0
dev.bge.0.stats.rx.ifHCInOctets: 3445050017
dev.bge.0.stats.rx.Fragments: 0
dev.bge.0.stats.rx.UnicastPkts: 21457049
dev.bge.0.stats.rx.MulticastPkts: 4433
dev.bge.0.stats.rx.BroadcastPkts: 270589
dev.bge.0.stats.rx.FCSErrors: 0
dev.bge.0.stats.rx.AlignmentErrors: 0
dev.bge.0.stats.rx.xonPauseFramesReceived: 0
dev.bge.0.stats.rx.xoffPauseFramesReceived: 0
dev.bge.0.stats.rx.ControlFramesReceived: 0
dev.bge.0.stats.rx.xoffStateEntered: 0
[highlight]dev.bge.0.stats.rx.FramesTooLong: 799[/highlight]
dev.bge.0.stats.rx.Jabbers: 0
dev.bge.0.stats.rx.UndersizePkts: 0
dev.bge.0.stats.tx.ifHCOutOctets: 3984405548
dev.bge.0.stats.tx.Collisions: 0
dev.bge.0.stats.tx.XonSent: 0
dev.bge.0.stats.tx.XoffSent: 0
dev.bge.0.stats.tx.InternalMacTransmitErrors: 0
dev.bge.0.stats.tx.SingleCollisionFrames: 0
dev.bge.0.stats.tx.MultipleCollisionFrames: 0
dev.bge.0.stats.tx.DeferredTransmissions: 0
dev.bge.0.stats.tx.ExcessiveCollisions: 0
dev.bge.0.stats.tx.LateCollisions: 0
dev.bge.0.stats.tx.UnicastPkts: 17497712
dev.bge.0.stats.tx.MulticastPkts: 0
dev.bge.0.stats.tx.BroadcastPkts: 2
# vmstat -z [A lot of output, nothing useful as far as I could tell]
# netstat -s | grep buffer
Code:
42 dropped due to full socket buffers
0 messages dropped due to full socket buffers
# netstat -s | grep errors
Code:
0 times sctp_senderrors were caused from a user
0 errors not generated in response to an icmp message
0 errors not generated in response to an icmp6 message
0 errors not generated because of rate limitation
The line I found interesting was dev.bge.0.stats.rx.FramesTooLong: 799 as the value matched the Ierr value in the output of
/usr/bin/netstat -i -b -n -I bge0. So the question is what does FramesTooLong mean? I've had a google around but I've not been able to find any suggestion as to what it means? Initially I thought perhaps it was possible related to TTL, but I think that's related to packets not frames and therefore not related?Any help gratefully received!