Hello, (forgive my bad english, it's not my main language)
Yesterday, my server behaved very strangely. It's a 4-core Xeon running:
dmesg.boot is too long for the post, so it's available here: dmesg
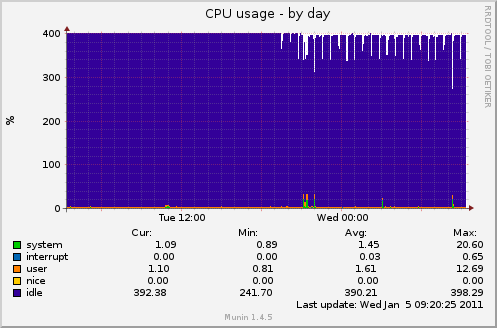
Around 19:30, my munin monitoring started to display a less than normal CPU utilization (less than 400%, idle included). ACPI uses factory settings (never touched).
I don't see any good reason for my cpu utilization probe to report less than 400%. See graph:
At 21:08:23, I've launched the steam client, a linux binary, to update my source dedicated server (a game server). The process downloads available updates after scanning few GB of file hosted on a ZFS formated disk (compression enabled). The disk is a SATA HDD, plugged on a 3Ware RAID card. The process ended around 21:10:30
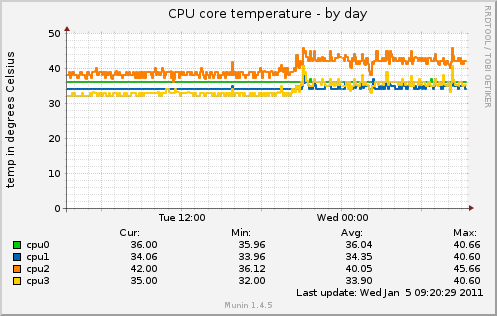
The CPU core temperature started to rise at this moment, increasing by few degrees C. It never get back to its normal value. The hosting provider tells me his monitoring for the rack shows no temperature increase.
At 21:09:09, the system logs showed a bunch of alert:
Around 21:12, I've launched the updated game server (linux binary). The game was almost unplayable. Game clients (player side) reported a ping around 60, in general we have between 15 and 30. But 60 should be playable. Despite a not-so-bad ping, the game was constantly freezing on client side. The freeze was short, but occurred every 3-5 seconds, and eventually every seconds.
Uptime is 53 days. The game server, and the whole server in general behaved flawlessly until yesterday. The game server is launched only few times a week, for few hours.
Any idea is greatly appreciated.
patpro
Yesterday, my server behaved very strangely. It's a 4-core Xeon running:
Code:
FreeBSD 8.1-RELEASE #0: Mon Jul 19 02:36:49 UTC 2010 root@mason.cse.buffalo.edu:/usr/obj/usr/src/sys/GENERIC amd64dmesg.boot is too long for the post, so it's available here: dmesg
Around 19:30, my munin monitoring started to display a less than normal CPU utilization (less than 400%, idle included). ACPI uses factory settings (never touched).
I don't see any good reason for my cpu utilization probe to report less than 400%. See graph:
At 21:08:23, I've launched the steam client, a linux binary, to update my source dedicated server (a game server). The process downloads available updates after scanning few GB of file hosted on a ZFS formated disk (compression enabled). The disk is a SATA HDD, plugged on a 3Ware RAID card. The process ended around 21:10:30
The CPU core temperature started to rise at this moment, increasing by few degrees C. It never get back to its normal value. The hosting provider tells me his monitoring for the rack shows no temperature increase.
At 21:09:09, the system logs showed a bunch of alert:
Code:
21:09:09 rack kernel: calcru: runtime went backwards from 122407344 usec
to 108865844 usec for pid 2 (g_event)
21:09:09 rack kernel: calcru: runtime went backwards from 3293977567
usec to 2931366351 usec for pid 12 (intr)
...
Around 21:12, I've launched the updated game server (linux binary). The game was almost unplayable. Game clients (player side) reported a ping around 60, in general we have between 15 and 30. But 60 should be playable. Despite a not-so-bad ping, the game was constantly freezing on client side. The freeze was short, but occurred every 3-5 seconds, and eventually every seconds.
Uptime is 53 days. The game server, and the whole server in general behaved flawlessly until yesterday. The game server is launched only few times a week, for few hours.
Any idea is greatly appreciated.
patpro