proxmox Performance Issues with Proxmox

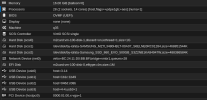
Hi, I recently started running FreeBSD 14 as a guest on Proxmox 8.4, and I've been surprised by the low I/O performance, I'm not sure what's going on. Here's some of the statistics, of the FreeBSD VM and also a Debian 12 VM on the same hypervisor. I tried the "kern.timecounter.hardware=TSC-low" workaround, which didn't appear to help. FreeBSD runs fine on another system running Hyper-V, so I think it's an issue with KVM/Proxmox. I used to do custom kernel builds of FreeBSD, so I might look into if there's a kernel tweak (or dtrace) to test with.

Code:
ryan@bsd ~ $% fio --randrepeat=1 --direct=1 --gtod_reduce=1 --name=test --bs=4k --iodepth=64 --readwrite=randrw --rwmixread=75 --size=3G --filename=test
test: (g=0): rw=randrw, bs=(R) 4096B-4096B, (W) 4096B-4096B, (T) 4096B-4096B, ioengine=psync, iodepth=64
fio-3.38
Starting 1 process
test: Laying out IO file (1 file / 3072MiB)
note: both iodepth >= 1 and synchronous I/O engine are selected, queue depth will be capped at 1
Jobs: 1 (f=1): [m(1)][94.1%][eta 00m:44s]
test: (groupid=0, jobs=1): err= 0: pid=1131: Thu Apr 24 04:34:07 2025
  read: IOPS=832, BW=3330KiB/s (3410kB/s)(2301MiB/707658msec)
   bw (  KiB/s): min=  593, max=253936, per=100.00%, avg=52986.39, stdev=35179.06, samples=89
   iops        : min=  148, max=63484, avg=13246.49, stdev=8794.78, samples=89
  write: IOPS=278, BW=1115KiB/s (1142kB/s)(771MiB/707658msec); 0 zone resets
   bw (  KiB/s): min=  280, max=85640, per=100.00%, avg=17745.73, stdev=11815.42, samples=89
   iops        : min=   70, max=21410, avg=4436.31, stdev=2953.86, samples=89
  cpu          : usr=0.08%, sys=4.40%, ctx=550, majf=0, minf=0
  IO depths    : 1=100.0%, 2=0.0%, 4=0.0%, 8=0.0%, 16=0.0%, 32=0.0%, >=64=0.0%
     submit    : 0=0.0%, 4=100.0%, 8=0.0%, 16=0.0%, 32=0.0%, 64=0.0%, >=64=0.0%
     complete  : 0=0.0%, 4=100.0%, 8=0.0%, 16=0.0%, 32=0.0%, 64=0.0%, >=64=0.0%
     issued rwts: total=589126,197306,0,0 short=0,0,0,0 dropped=0,0,0,0
     latency   : target=0, window=0, percentile=100.00%, depth=64

Run status group 0 (all jobs):
   READ: bw=3330KiB/s (3410kB/s), 3330KiB/s-3330KiB/s (3410kB/s-3410kB/s), io=2301MiB (2413MB), run=707658-707658msec
  WRITE: bw=1115KiB/s (1142kB/s), 1115KiB/s-1115KiB/s (1142kB/s-1142kB/s), io=771MiB (808MB), run=707658-707658msec

Code:
ryan@debian ~ $% fio --randrepeat=1 --direct=1 --gtod_reduce=1 --name=test --bs=4k --iodepth=64 --readwrite=randrw --rwmixread=75 --size=3G --filename=test
test: (g=0): rw=randrw, bs=(R) 4096B-4096B, (W) 4096B-4096B, (T) 4096B-4096B, ioengine=psync, iodepth=64
fio-3.33
Starting 1 process
test: Laying out IO file (1 file / 3072MiB)
note: both iodepth >= 1 and synchronous I/O engine are selected, queue depth will be capped at 1
Jobs: 1 (f=1): [m(1)][100.0%][r=30.0MiB/s,w=10.6MiB/s][r=7683,w=2714 IOPS][eta 00m:00s]
test: (groupid=0, jobs=1): err= 0: pid=8199: Thu Apr 24 05:25:51 2025
  read: IOPS=5907, BW=23.1MiB/s (24.2MB/s)(2301MiB/99727msec)
   bw (  KiB/s): min=14464, max=37376, per=100.00%, avg=23653.38, stdev=5527.81, samples=199
   iops        : min= 3616, max= 9344, avg=5913.34, stdev=1381.95, samples=199
  write: IOPS=1978, BW=7914KiB/s (8104kB/s)(771MiB/99727msec); 0 zone resets
   bw (  KiB/s): min= 4888, max=12920, per=100.00%, avg=7923.30, stdev=1861.57, samples=199
   iops        : min= 1222, max= 3230, avg=1980.82, stdev=465.39, samples=199
  cpu          : usr=3.31%, sys=15.13%, ctx=786454, majf=0, minf=7
  IO depths    : 1=100.0%, 2=0.0%, 4=0.0%, 8=0.0%, 16=0.0%, 32=0.0%, >=64=0.0%
     submit    : 0=0.0%, 4=100.0%, 8=0.0%, 16=0.0%, 32=0.0%, 64=0.0%, >=64=0.0%
     complete  : 0=0.0%, 4=100.0%, 8=0.0%, 16=0.0%, 32=0.0%, 64=0.0%, >=64=0.0%
     issued rwts: total=589126,197306,0,0 short=0,0,0,0 dropped=0,0,0,0
     latency   : target=0, window=0, percentile=100.00%, depth=64

Run status group 0 (all jobs):
   READ: bw=23.1MiB/s (24.2MB/s), 23.1MiB/s-23.1MiB/s (24.2MB/s-24.2MB/s), io=2301MiB (2413MB), run=99727-99727msec
  WRITE: bw=7914KiB/s (8104kB/s), 7914KiB/s-7914KiB/s (8104kB/s-8104kB/s), io=771MiB (808MB), run=99727-99727msec

Disk stats (read/write):
  sda: ios=588970/197376, merge=0/61, ticks=63484/58123, in_queue=155130, util=83.80%
 
Im doing my test now - wanna see difference between yours and mine.
Code:
    fio --randrepeat=1 --direct=1 --gtod_reduce=1 --name=test --bs=4k --iodepth=64 --readwrite=randrw --rwmixread=75 --size=3G --filename=test
test: (g=0): rw=randrw, bs=(R) 4096B-4096B, (W) 4096B-4096B, (T) 4096B-4096B, ioengine=psync, iodepth=64
fio-3.38
Starting 1 process
test: Laying out IO file (1 file / 3072MiB)
note: both iodepth >= 1 and synchronous I/O engine are selected, queue depth will be capped at 1
Jobs: 1 (f=1): [m(1)][99.6%][r=19.9MiB/s,w=7144KiB/s][r=5100,w=1786 IOPS][eta 00m:01s]
test: (groupid=0, jobs=1): err= 0: pid=75950: Thu Apr 24 07:24:05 2025
  read: IOPS=2623, BW=10.2MiB/s (10.7MB/s)(2301MiB/224535msec)
   bw (  KiB/s): min=  840, max=31344, per=100.00%, avg=10498.72, stdev=6494.72, samples=448
   iops        : min=  210, max= 7836, avg=2624.60, stdev=1623.66, samples=448
  write: IOPS=878, BW=3515KiB/s (3599kB/s)(771MiB/224535msec); 0 zone resets
   bw (  KiB/s): min=  280, max=10672, per=100.00%, avg=3516.87, stdev=2198.11, samples=448
   iops        : min=   70, max= 2668, avg=879.14, stdev=549.50, samples=448
  cpu          : usr=0.86%, sys=26.52%, ctx=60817, majf=2, minf=0
  IO depths    : 1=100.0%, 2=0.0%, 4=0.0%, 8=0.0%, 16=0.0%, 32=0.0%, >=64=0.0%
     submit    : 0=0.0%, 4=100.0%, 8=0.0%, 16=0.0%, 32=0.0%, 64=0.0%, >=64=0.0%
     complete  : 0=0.0%, 4=100.0%, 8=0.0%, 16=0.0%, 32=0.0%, 64=0.0%, >=64=0.0%
     issued rwts: total=589126,197306,0,0 short=0,0,0,0 dropped=0,0,0,0
     latency   : target=0, window=0, percentile=100.00%, depth=64

Run status group 0 (all jobs):
   READ: bw=10.2MiB/s (10.7MB/s), 10.2MiB/s-10.2MiB/s (10.7MB/s-10.7MB/s), io=2301MiB (2413MB), run=224535-224535msec
  WRITE: bw=3515KiB/s (3599kB/s), 3515KiB/s-3515KiB/s (3599kB/s-3599kB/s), io=771MiB (808MB), run=224535-224535msec

Code:
    fio --randrepeat=1 --direct=1 --gtod_reduce=1 --name=test --bs=4k --iodepth=64 --readwrite=randrw --rwmixread=75 --size=3G --filename=test
test: (g=0): rw=randrw, bs=(R) 4096B-4096B, (W) 4096B-4096B, (T) 4096B-4096B, ioengine=psync, iodepth=64
fio-3.38
Starting 1 process
note: both iodepth >= 1 and synchronous I/O engine are selected, queue depth will be capped at 1
Jobs: 1 (f=1): [m(1)][100.0%][r=42.9MiB/s,w=15.0MiB/s][r=11.0k,w=3852 IOPS][eta 00m:00s]
test: (groupid=0, jobs=1): err= 0: pid=3658: Thu Apr 24 07:27:41 2025
  read: IOPS=3548, BW=13.9MiB/s (14.5MB/s)(2301MiB/166042msec)
   bw (  KiB/s): min= 1712, max=40280, per=99.35%, avg=14100.44, stdev=7682.31, samples=331
   iops        : min=  428, max=10070, avg=3525.02, stdev=1920.52, samples=331
  write: IOPS=1188, BW=4753KiB/s (4867kB/s)(771MiB/166042msec); 0 zone resets
   bw (  KiB/s): min=  592, max=14452, per=99.37%, avg=4723.24, stdev=2601.81, samples=331
   iops        : min=  148, max= 3613, avg=1180.70, stdev=650.42, samples=331
  cpu          : usr=1.12%, sys=35.15%, ctx=41390, majf=0, minf=0
  IO depths    : 1=100.0%, 2=0.0%, 4=0.0%, 8=0.0%, 16=0.0%, 32=0.0%, >=64=0.0%
     submit    : 0=0.0%, 4=100.0%, 8=0.0%, 16=0.0%, 32=0.0%, 64=0.0%, >=64=0.0%
     complete  : 0=0.0%, 4=100.0%, 8=0.0%, 16=0.0%, 32=0.0%, 64=0.0%, >=64=0.0%
     issued rwts: total=589126,197306,0,0 short=0,0,0,0 dropped=0,0,0,0
     latency   : target=0, window=0, percentile=100.00%, depth=64

Run status group 0 (all jobs):
   READ: bw=13.9MiB/s (14.5MB/s), 13.9MiB/s-13.9MiB/s (14.5MB/s-14.5MB/s), io=2301MiB (2413MB), run=166042-166042msec
  WRITE: bw=4753KiB/s (4867kB/s), 4753KiB/s-4753KiB/s (4867kB/s-4867kB/s), io=771MiB (808MB), run=166042-166042msec

How did you set up your FreeBSD VM and what do you use ? I use 2 ssd`s ( pcie passtrough ) ... both are samsung ones but one is server grade 480GB (SAMSUNG MZ7L3480HBLT-00A07 ) and another is normal 500GB ( SAMSUNG 860 EVO 500GB )
So basically when i install my FreeBSD i choose bot hard drives passed to the VM also as i have dual cpu system - i use NUMA .
Also if you created zfs pool for your FreeBSD VM - you chose ZFS or UFS while installing FreeBSD ?
 
  • please provide which storage you use on the host, and what is each VM using. Do you use virtio for both?
  • please provide info on the filesystems within the VMs where you make your tests.
 
test: (groupid=0, jobs=1): err= 0: pid=73964: Thu Apr 24 16:17:00 2025
read: IOPS=102, BW=411KiB/s (421kB/s)(2301MiB/5730597msec)
bw ( KiB/s): min= 95, max= 3776, per=99.95%, avg=411.00, stdev=180.81, samples=11416
iops : min= 23, max= 944, avg=102.36, stdev=45.23, samples=11416
write: IOPS=34, BW=138KiB/s (141kB/s)(771MiB/5730597msec); 0 zone resets
bw ( KiB/s): min= 15, max= 1258, per=99.48%, avg=137.40, stdev=67.04, samples=11416
iops : min= 3, max= 314, avg=33.77, stdev=16.79, samples=11416
cpu : usr=0.13%, sys=1.06%, ctx=503586, majf=0, minf=0
IO depths : 1=100.0%, 2=0.0%, 4=0.0%, 8=0.0%, 16=0.0%, 32=0.0%, >=64=0.0%
submit : 0=0.0%, 4=100.0%, 8=0.0%, 16=0.0%, 32=0.0%, 64=0.0%, >=64=0.0%
complete : 0=0.0%, 4=100.0%, 8=0.0%, 16=0.0%, 32=0.0%, 64=0.0%, >=64=0.0%
issued rwts: total=589126,197306,0,0 short=0,0,0,0 dropped=0,0,0,0
latency : target=0, window=0, percentile=100.00%, depth=64

Run status group 0 (all jobs):
READ: bw=411KiB/s (421kB/s), 411KiB/s-411KiB/s (421kB/s-421kB/s), io=2301MiB (2413MB), run=5730597-5730597msec
WRITE: bw=138KiB/s (141kB/s), 138KiB/s-138KiB/s (141kB/s-141kB/s), io=771MiB (808MB), run=5730597-5730597msec

adaptec Raid 10 spinning rust host, vm was ZFS virtio SCSI single
 
  • please provide which storage you use on the host, and what is each VM using. Do you use virtio for both?
  • please provide info on the filesystems within the VMs where you make your tests.
The system is not in production so it's fairly quiet except for the tests I've been doing. The host is using ZFS, VM storage is on a 1tb ssd. Both VMs I tested with are using virtio, I've tested the FreeBSD VM with most settings and couldn't find a solution. The FreeBSD guest is using ZFS also, I might try with UFS to see if there's any difference.

BSD VM:
Memory 64gb, Processors 36 (2x18 cores, NUMA) (I've tried with and without NUMA, and reducing cores), BIOS UEFI, Machine is Q35 (Latest), Hard disk is SCSI using VirtIO SCSI, and network devices are VirtIO.

Debian VM:
Memory 32gb, Processors 18 (1x18 cores, no NUMA), everything else is the same as the BSD VM.

Host is a Dell PowerEdge R640, it uses a SAS controller but the disks are SATA.
 
Proxmox by default uses 8k volblocksize for ZFS storage, if i remember correctly. You can try to create a new ZFS storage in Proxmox web interface and try with the bigger block size, 32k or 64k, move your VM there and test again.
 
The system is not in production so it's fairly quiet except for the tests I've been doing. The host is using ZFS, VM storage is on a 1tb ssd. Both VMs I tested with are using virtio, I've tested the FreeBSD VM with most settings and couldn't find a solution. The FreeBSD guest is using ZFS also
Dont use ZFS on top of ZFS. If your FreeBSD VM is inside Proxmox zfs pool - use UFS.
Im not sure if this will help but its an advice.

Pic of my setup.
 

Attachments

  • fbsdvm.png
    fbsdvm.png
    66.2 KB · Views: 191
Dont use ZFS on top of ZFS. If your FreeBSD VM is inside Proxmox zfs pool - use UFS.
Im not sure if this will help but its an advice.

Pic of my setup.
I tried creating another filesystem as UFS, and tested it on it, it's not showing much improvement.


test: (groupid=0, jobs=1): err= 0: pid=2297: Thu Apr 24 13:37:49 2025
read: IOPS=2401, BW=9607KiB/s (9837kB/s)(2301MiB/245303msec)
bw ( KiB/s): min= 5088, max=108816, per=100.00%, avg=9617.26, stdev=5470.32, samples=490
iops : min= 1272, max=27204, avg=2404.15, stdev=1367.60, samples=490
write: IOPS=804, BW=3217KiB/s (3295kB/s)(771MiB/245303msec); 0 zone resets
bw ( KiB/s): min= 1675, max=36056, per=100.00%, avg=3221.12, stdev=1820.82, samples=490
iops : min= 418, max= 9014, avg=805.11, stdev=455.22, samples=490
cpu : usr=0.65%, sys=11.23%, ctx=674842, majf=0, minf=0
IO depths : 1=100.0%, 2=0.0%, 4=0.0%, 8=0.0%, 16=0.0%, 32=0.0%, >=64=0.0%
submit : 0=0.0%, 4=100.0%, 8=0.0%, 16=0.0%, 32=0.0%, 64=0.0%, >=64=0.0%
complete : 0=0.0%, 4=100.0%, 8=0.0%, 16=0.0%, 32=0.0%, 64=0.0%, >=64=0.0%
issued rwts: total=589126,197306,0,0 short=0,0,0,0 dropped=0,0,0,0
latency : target=0, window=0, percentile=100.00%, depth=64

Run status group 0 (all jobs):
READ: bw=9607KiB/s (9837kB/s), 9607KiB/s-9607KiB/s (9837kB/s-9837kB/s), io=2301MiB (2413MB), run=245303-245303msec
WRITE: bw=3217KiB/s (3295kB/s), 3217KiB/s-3217KiB/s (3295kB/s-3295kB/s), io=771MiB (808MB), run=245303-245303msec
As far as i can see - basically x3 times. so it is an improvement.
If you have spare drive - i would try to pass it. No spare drive ? Maybe re-do Proxmox and use ext4 and then try to play around with ZFS or UFS inside FreeBSD.
 
As far as i can see - basically x3 times. so it is an improvement.
If you have spare drive - i would try to pass it. No spare drive ? Maybe re-do Proxmox and use ext4 and then try to play around with ZFS or UFS inside FreeBSD.
Yeah sorry, I was looking at the wrong result field, the performance better with that. I can't really redo Proxmox on that system, since it has other VMs that will be used fairly soon. I'll have to test it on UFS, but I noticed that when fio was run on the ZFS partition, the system wouldn't really load up, disk and CPU usage would be low, I was assuming it was heavily using RAM, but am not really that sure. I mainly tested that using the app xosview.
 
Yeah sorry, I was looking at the wrong result field, the performance better with that. I can't really redo Proxmox on that system, since it has other VMs that will be used fairly soon. I'll have to test it on UFS, but I noticed that when fio was run on the ZFS partition, the system wouldn't really load up, disk and CPU usage would be low, I was assuming it was heavily using RAM, but am not really that sure. I mainly tested that using the app xosview.
Check this video and try to duplicate install and test it again. At least i used this video but without storage as i passed physical devices.
UFS vs ZFS ram usage is different.
Another thing - if you do have more than one CPU - NUMA enabling should give you better performance ( maybe ! as for me it was better than without enabling ( without NUMA i had huge stutters every time i moved mouse ar did something ).

With bhyve there is advice to use not virtio, but nvme. Maybe checking this on proxmox is reasonable.
Proxmox does not have this option for "nvme"
its scsi , SATA, IDE and VirtIO Block
 
After a number of tests, and changing SCSI controllers, trying SATA and IDE, most of the major performance issues seem to be nested ZFS. SCSI vs SATA didn't really provide any improvement. With UFS, the disk performance is still around 40% of Debian, so I'm wondering what the bottleneck could be. I'll reinstall the VM using UFS, and then do more testing.
 
you should change it to "VirtIO Block" then.
I did that and reconfigured the root, getting better performance with it:

Code:
test: (groupid=0, jobs=1): err= 0: pid=1025: Fri Apr 25 03:16:37 2025
  read: IOPS=4104, BW=16.0MiB/s (16.8MB/s)(2301MiB/143548msec)
   bw (  KiB/s): min= 9819, max=118008, per=100.00%, avg=16433.03, stdev=8161.03, samples=286
   iops        : min= 2454, max=29502, avg=4108.14, stdev=2040.30, samples=286
  write: IOPS=1374, BW=5498KiB/s (5630kB/s)(771MiB/143548msec); 0 zone resets
   bw (  KiB/s): min= 3286, max=39136, per=100.00%, avg=5505.05, stdev=2721.86, samples=286
   iops        : min=  821, max= 9784, avg=1376.14, stdev=680.51, samples=286
  cpu          : usr=0.94%, sys=16.21%, ctx=676560, majf=0, minf=0
  IO depths    : 1=100.0%, 2=0.0%, 4=0.0%, 8=0.0%, 16=0.0%, 32=0.0%, >=64=0.0%
     submit    : 0=0.0%, 4=100.0%, 8=0.0%, 16=0.0%, 32=0.0%, 64=0.0%, >=64=0.0%
     complete  : 0=0.0%, 4=100.0%, 8=0.0%, 16=0.0%, 32=0.0%, 64=0.0%, >=64=0.0%
     issued rwts: total=589126,197306,0,0 short=0,0,0,0 dropped=0,0,0,0
     latency   : target=0, window=0, percentile=100.00%, depth=64

Run status group 0 (all jobs):
   READ: bw=16.0MiB/s (16.8MB/s), 16.0MiB/s-16.0MiB/s (16.8MB/s-16.8MB/s), io=2301MiB (2413MB), run=143548-143548msec
  WRITE: bw=5498KiB/s (5630kB/s), 5498KiB/s-5498KiB/s (5630kB/s-5630kB/s), io=771MiB (808MB), run=143548-143548msec
 
Right now I've only 14.0-RELEASE-p2 in my proxmox but that should not matter much.
Both running on the same node, same setup, same DS.

Debian:
Code:
agent: 1
boot: order=scsi0;ide2;net0
cores: 2
cpu: x86-64-v2-AES
ide2: none,media=cdrom
memory: 2048
meta: creation-qemu=8.1.5,ctime=1718751938
name: debian
net0: virtio=AA:24:11:AA:77:AA,bridge=vmbr0,firewall=1
numa: 0
onboot: 1
ostype: l26
scsi0: DS-AA:1337/vm-4301-disk-0.qcow2,iothread=1,size=32G
scsihw: virtio-scsi-single
smbios1: uuid=7514fc7a-ff84-48ca-af29-be4f6ac48316
sockets: 1
tags: debian
usb0: host=32e4:9230

FreeBSD
Code:
agent: 1,fstrim_cloned_disks=1
bios: seabios
boot: order=virtio0;ide2;net0
cores: 2
ide2: none,media=cdrom
machine: q35
memory: 4096
meta: creation-qemu=7.1.0,ctime=1668898559
name: freebsd
net0: virtio=AA:01:AA:93:AA:4A,bridge=vmbr0,firewall=1
numa: 0
ostype: other
scsihw: virtio-scsi-pci
smbios1: uuid=76f6a36e-470b-4266-a0ec-35937e71142d
sockets: 1
virtio0: DS-AA:666/vm-600-disk-0.qcow2,aio=native,iothread=1,size=20G
And they perform about the same:

Debian
Code:
   READ: bw=28.8MiB/s (30.2MB/s), 28.8MiB/s-28.8MiB/s (30.2MB/s-30.2MB/s), io=2301MiB (2413MB), run=79856-79856msec
  WRITE: bw=9883KiB/s (10.1MB/s), 9883KiB/s-9883KiB/s (10.1MB/s-10.1MB/s), io=771MiB (808MB), run=79856-79856msec

FreeBSD
Code:
   READ: bw=32.1MiB/s (33.6MB/s), 32.1MiB/s-32.1MiB/s (33.6MB/s-33.6MB/s), io=2301MiB (2413MB), run=71764-71764msec
  WRITE: bw=10.7MiB/s (11.3MB/s), 10.7MiB/s-10.7MiB/s (11.3MB/s-11.3MB/s), io=771MiB (808MB), run=71764-71764msec
Which are sad speeds. I'm assuming it's because of the command and its parameters.

During single file copy debian (ext4) was perfoming a bit better than FreeBSD (zfs). With debian I was able to reach and hold ~230MBps. With FreeBSD it was ~ 170MBps. All in their default settings.
 
I did that and reconfigured the root, getting better performance with it:

... we are getting there. Was this with zfs? I bet when you choose ufs you will be in the ballpark of Debian/ext4. zfs does much more in the background than a traditional filesystem like ext4 or ufs so benchmarking against them is kind of comparing apples with bananas.
 
... we are getting there. Was this with zfs? I bet when you choose ufs you will be in the ballpark of Debian/ext4. zfs does much more in the background than a traditional filesystem like ext4 or ufs so benchmarking against them is kind of comparing apples with bananas.
That benchmark was with ufs. The performance is now pretty good with it - zfs would cause disk i/o to hang too much.
 
ok, still interesting why Linux is noticable faster. Did a quick test on my Linux KVM host and both guests (FreeBSD/ufs, Debian/ext4) deliver almost identical figures.
 
Typical IOPS tests are:
4KQD1 Random Read
4KQD1 Random Write
4kQD32 Random Read
4kQD32 Random Write

Typical SEQ tests are:
128KQDMAX (SATA=32, SAS=256) 4K aligned SeqRead
128KQDMAX (SATA=32, SAS=256) 4K aligned SeqWrite

Other tests are defined in SNIA PTSe like:
RND 4KiB 100% Write
RND 64KiB 65:30 RW
RND 1024KiB 100% Read

Testing the IOPS from the inside a VM will always give you a wrong results due to different queue buffers. Your test only can compare a difference between the VM storage and filesystems. For example you are trying to test QD64 (-iodepth=64) but you are using ioengine=psync
which only support QD1 and you end up of testing 4KQD1. You can use --ioengine=posixaio for FreeBSD as libaio is available only for Linux.

4KQD32 randread will look like this
fio --direct=1 --name=test --bs=4K --iodepth=32 --readwrite=randread --size=5G --filename=test --runtime=60 --ioengine=posixaio
Expected IOPS should be around 45K after the SSD cache is full or 98K when the cache is not full

128KQD32 Seq READ
fio --direct=1 --name=test --bs=128K --iodepth=32 --readwrite=read --size=5G --filename=test --runtime=60 --ioengine=posixaio
 
Back
Top