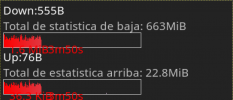
I am trying to remove the down and up text that is in red from displaying on my desktop on conky (See attached picture). Can someone tell me what am I doing wrong?
Code:
conky.config = {
    alignment = 'top_left',
    background = yes,
    border_width = 1,
    cpu_avg_samples = 2,
    default_color = 'white',
    default_outline_color = 'white',
    default_shade_color = 'white',
    draw_borders = false,
    draw_graph_borders = yes,
    draw_outline = false,
    draw_shades = false,
    use_xft = true,
    font = 'System San Francisco Display:size=10',
    gap_x = 5,
    gap_y = 40,
    minimum_height = 5,
    minimum_width = 5,
    net_avg_samples = 2,
    double_buffer = true,
    out_to_console = yes,
    out_to_ncurses = false,
    out_to_stderr = false,
    out_to_x = yes,
    extra_newline = false,
    own_window = yes,
    own_window_class = 'semi-conky',
    own_window_type = 'desktop',
    own_window_transparent = true,
    stippled_borders = 0,
    update_interval = 1.0,
    uppercase = false,
    use_spacer = 'none',
    show_graph_scale = true,
    show_graph_range = true,
    own_window_argb_visual = true,
    own_window_argb_value = 0,
    total_run_times = 0,
    own_window_hints = 'below,undecorated,skip_taskbar'
}

conky.text = [[
${alignc}${font System San Francisco Display:size=22}${time %A}, ${time %e} del mes de ${time %b} del año ${time %G}
${font System San Francisco Display:size=14}

${color grey}Nombre del Sistema:$color $nodename
${color grey}Sistema Operativo:$color $sysname $kernel kernel $machine
${color grey}Sistema Operando:$color $uptime
${color grey}Memoria RAM:$color $mem/$memmax - $memperc% ${membar 4}
${color grey}Archivo Swap:$color $swap/$swapmax - $swapperc% ${swapbar 4}
${color grey}Sistema de archivo:
$color / ${fs_used /}/${fs_size /} ${fs_bar 6 /}
${color grey}Uso del CPU:$color $cpu% # ${cpubar 4}
#${cpugraph -t cpu1 25,260,260 000000 93C9EB}
${cpugraph}
${color grey}Processos:$color $processes  ${color
grey}Rodando:$color $running_processes
${alignc}${color grey}
${alignc}IP Del Sistema:$color (${addr wlan0})
${color grey}${alignc}Estatísticas de tráfico:
$color ${alignc}${exec vnstat -i wlan0 | grep rx:}
${color white}Down:${downspeed wlan0} ${color grey}
Total de statistica de baja: ${totaldown wlan0}
${downspeedgraph wlan0 25,230 00000 93C9EB}
${color white}Up:${upspeed wlan0} ${color grey}
Total de estatistica arriba: ${totalup wlan0}
${upspeedgraph wlan0 25,230 00000 93C9EB}
${font System San Francisco Display:size=8

}
${color grey}Name:                     PID:    CPU:      MEM:
${color green}${top name 1}       ${top pid 1}  ${top cpu 1}    ${top mem 1}
${color green}${top name 2}       ${top pid 2}  ${top cpu 2}    ${top mem 2}
${color green}${top name 3}       ${top pid 3}  ${top cpu 3}    ${top mem 3}
${color green}${top name 4}       ${top pid 4}  ${top cpu 4}    ${top mem 4}
${color green}${top name 5}       ${top pid 5}  ${top cpu 5}    ${top mem 5}
${color green}${top name 6}       ${top pid 6}  ${top cpu 6}    ${top mem 6}
${color green}${top name 7}       ${top pid 7}  ${top cpu 7}    ${top mem 7}
${color green}${top name 8}       ${top pid 8}  ${top cpu 8}    ${top mem 8}
${color green}${top name 9}       ${top pid 9}  ${top cpu 8}    ${top mem 9}
${color green}${top name 10}       ${top pid 10}  ${top cpu 10}    ${top mem 10}
]]