
D
Deleted member 70435
Guest
LLDB FreeBSD Developer's Guide
LLDB practical guide for the FreeBSD Developer to remember some very important commands, in the evaluation of debugging the code.
Note: ‘(lldb)’ is the debugger prompt. ‘$’ is the shell prompt.
Same in two steps:
Use a double dash to load a command with command line arguments:
Note: For breakpoints to be set on line numbers, compile with debugging symbols.
Or simply:
Delete all breakpoints (short version)
Note: This modifies the first breakpoint with the condition to break if the variable x is less than 0.
Remove the condition on breakpoint 1.
Note: Don’t forget to run the application first. i.e. set a breakpoint at main, then set the watchpoint when you hit the breakpoint and continue. This is because the variable must exist in order to be watched. If the variable is declared in a later function, set the breakpoint there.
LLDB now supports the GDB shorthand format syntax but there can’t be space after the command:
Short version:
Optionally show a specific variable e.g. x
Or with Intel disassembly flavor
You may need to use lldb(1) to run the program and set a breakpoint before your program exits.
When you run leaks, it tells you if it found any memory leaks e.g.
That’s bad news bears, it found 4 leaks. In this case a function may return early without freeing one of the pointers we allocated. If you don’t know where your leak is, leaks has got your back again, it will give you a list of the memory addresses to the allocated memory so we can examine it.
I can see hex values in the range of ASCII characters because in my case the memory leak is a string. What even was that string though? Find out by examining the characters. 24 should be more than enough to tell me what the string is and then find the exact function which returns without freeing the memory.
We are examining 24 bytes as chars from the memory address which was identified as the culprit. That’s enough for me to find the line of code causing problems and fix it. If you need to, refer to the debugging cheatsheet to pinpoint the problem.
That’s better, no more leaks. The leaks tool and LLDB are amazing! It is recommended to use leaks during unit testing to get the most out of it.
2. FreeBSD man page
3. GDB and LLDB command examples
4. LLDB tutorial
References:
dynamiclib command line option
Apple Developer tools article
Or with Intel assembler:
Reference: clang command guide
Reference: Diagnostics reference
From the man page: -O0 Means “no optimization”: this level compiles the fastest and generates the most debuggable code.
Compiling with debugging symbols creates a .dSYM directory.
LLDB practical guide for the FreeBSD Developer to remember some very important commands, in the evaluation of debugging the code.
Note: ‘(lldb)’ is the debugger prompt. ‘$’ is the shell prompt.
load a program into lldb
$ lldb helloSame in two steps:
Code:
$ lldb
(lldb) file /path/to/file/hello
Use a double dash to load a command with command line arguments:
$ lldb -- program -arg1 arg2get help
(lldb) help dibreakpoints
(lldb) breakpoint set -n mainNote: For breakpoints to be set on line numbers, compile with debugging symbols.
$ c++ -std=c++11 -g -O0 -o case_study case_study.cc- We are compiling a C++ file (c++).
- Using the C++ 11 standards from 2011 (-std=c++11).
- Debugging symbols are added, optimisations removed (-g -O0).
- Output file is case_study (-o case_study)
- File being compiled is case_study.cc
(lldb) breakpoint set -f case_study.cc -l 39- We are setting a new breakpoint (breakpoint set).
- The source file is case_study.cc (
-f case_study.cc). - The breakpoint is set on line 39 of the source file (
-l 39).
List breakpoints
(lldb) breakpoint listOr simply:
(lldb) br lDelete breakpoints
Delete a specific breakpoint by breakpoint number e.g. 4: (lldb) breakpoint delete 4Delete all breakpoints (short version)
(lldb) br delConditional breakpoints
(lldb) br mod -c "x < 0" 1Note: This modifies the first breakpoint with the condition to break if the variable x is less than 0.
Remove the condition on breakpoint 1.
(lldb) br mod -c "" 1References
1. Stack overflowWatchpoints
Watch a variable with a watchpoint.Set watchpoint
(lldb) watch set var globalList watchpoints
(lldb) wa l (short version)Note: Don’t forget to run the application first. i.e. set a breakpoint at main, then set the watchpoint when you hit the breakpoint and continue. This is because the variable must exist in order to be watched. If the variable is declared in a later function, set the breakpoint there.
Running the application
Start the application
(lldb) rSingle step
(lldb) sStep over
(lldb) nContinue execution
Until next breakpoint or end of program (or crash): (lldb) cExamine memory
On the stack
(lldb) x -s4 -fx -c24 $rspLLDB now supports the GDB shorthand format syntax but there can’t be space after the command:
(lldb) x/24wx $rsp (lldb) x/64gx $rspExamine the next 2 instructions
(lldb) x/2i $ripReferences
1. Memory examination using gdb shorthandShow the content of the registers
(lldb) register readExamining the call stack
Show local variables
(lldb) frame variableShort version:
(lldb) fr vOptionally show a specific variable e.g. x
(lldb) fr v xprint backtrace
(lldb) thread backtrace (lldb) btList the threads
(lldb) thread listReferences
1. Examining the call stackDisassembly
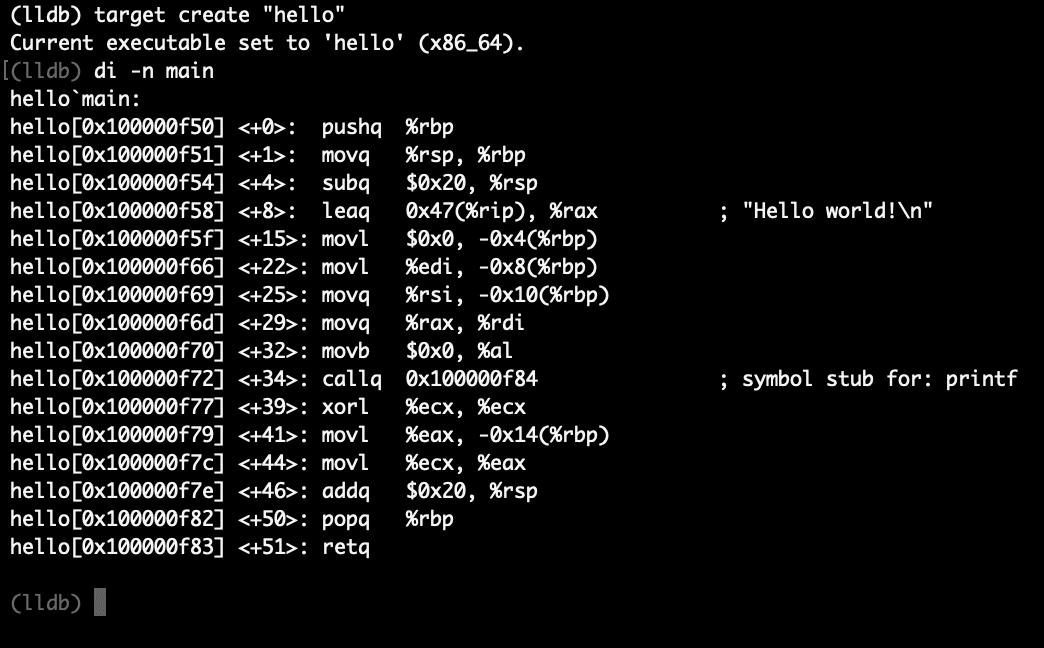
Print disassembly for main function
(lldb) di -n mainOr with Intel disassembly flavor
(lldb) di -F intel -n mainFinding memory leaks
The leaks command line tool
For usage instructions, refer to the man page. Basic usage is quite simple, leaks [pid]$ leaks 661You may need to use lldb(1) to run the program and set a breakpoint before your program exits.
ps aux | grep “program_name” can be used to find the PID of the target program.When you run leaks, it tells you if it found any memory leaks e.g.
Code:
Process 661: 4 leaks for 4032 total leaked bytes.That’s bad news bears, it found 4 leaks. In this case a function may return early without freeing one of the pointers we allocated. If you don’t know where your leak is, leaks has got your back again, it will give you a list of the memory addresses to the allocated memory so we can examine it.
(lldb) x/4wx 0x10badc0deI can see hex values in the range of ASCII characters because in my case the memory leak is a string. What even was that string though? Find out by examining the characters. 24 should be more than enough to tell me what the string is and then find the exact function which returns without freeing the memory.
(lldb) x/24bc 0x10badc0deWe are examining 24 bytes as chars from the memory address which was identified as the culprit. That’s enough for me to find the line of code causing problems and fix it. If you need to, refer to the debugging cheatsheet to pinpoint the problem.
Code:
Process 883: 0 leaks for 0 total leaked bytes.References:
Finding leaksFurther reading
1. LLDB website2. FreeBSD man page
3. GDB and LLDB command examples
4. LLDB tutorial
Bonus clang cheatsheet
Create dynamic library
$ cc -dynamiclib -o student.dylib student.c second_file.c third_file.cReferences:
dynamiclib command line option
Apple Developer tools article
Compile app using dynamic library
$ cc -o dyn_student_app student.dylib student_app.cCompile to assembly
Generate assembly using -S:$ cc -S -o app.s app.cOr with Intel assembler:
$ cc -S -masm=intel -o hello.intel.s hello.cReference: clang command guide
Turn on all warnings
$ cc -Wall -o app app.cReference: Diagnostics reference
Compiling a C++ file with the C++ 11 standards
$ c++ -std=c++11 -o quite_modern quite_modern.ccDebugging symbols
Use the-g option. To customise the optimisation use -O e.g. -O0.From the man page: -O0 Means “no optimization”: this level compiles the fastest and generates the most debuggable code.
Compiling with debugging symbols creates a .dSYM directory.
LLDB Cheatsheet - A Quick Reference For Useful Debugging Commands
The most useful debugging commands are right on your fingertips but the exact syntax has slipped your mind. The LLDB cheatsheet will refresh your memory.
firexfly.com
